Ethereum Dashboards
A collection of useful dashboards for the Ethereum ecosystem
A collection of useful dashboards for the Ethereum ecosystem
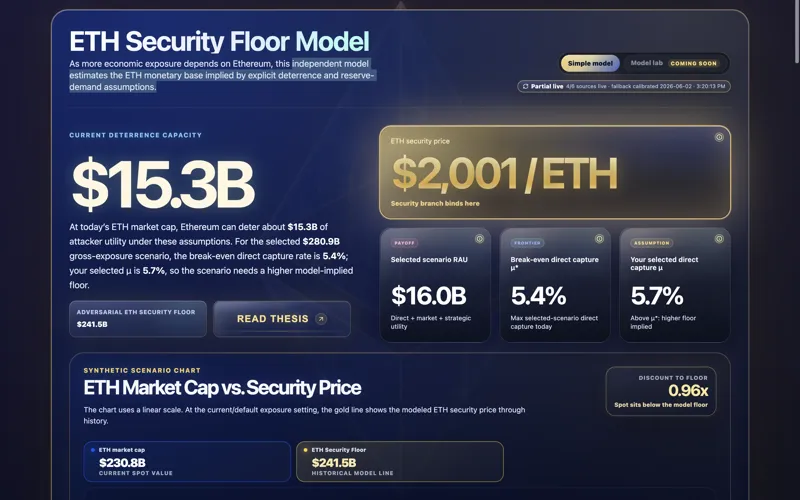
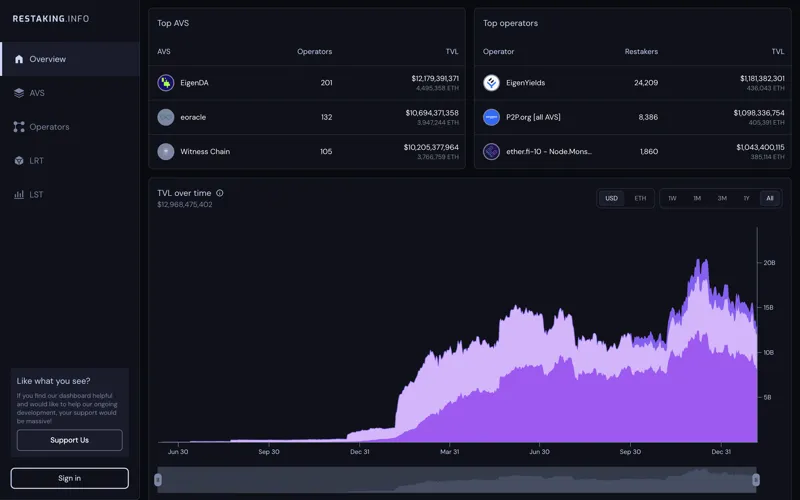
An independent model estimates the ETH monetary base implied by explicit deterrence and reserve-demand assumptions.
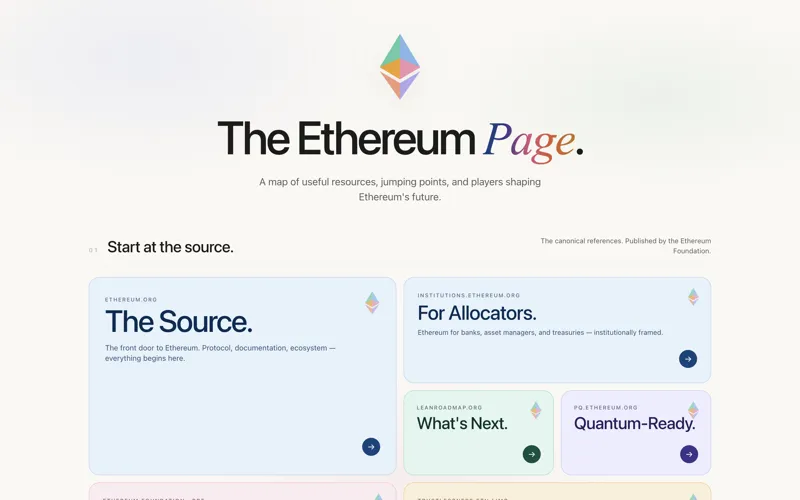
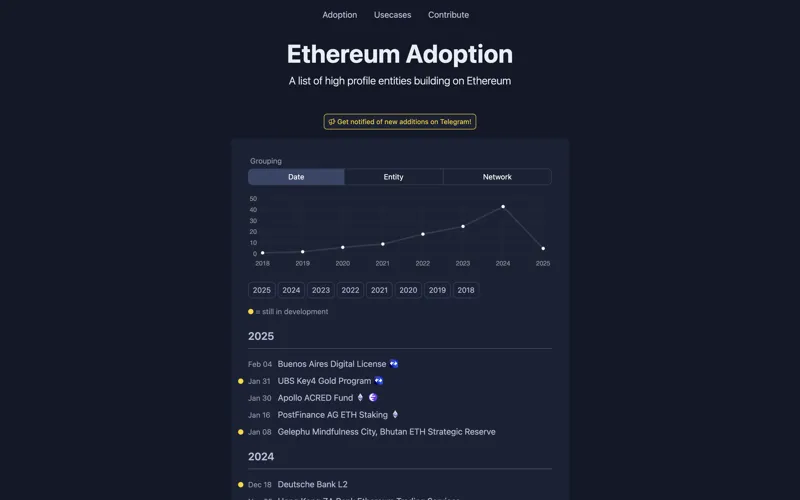
A map of useful resources, jumping points, and players shaping Ethereum's future.
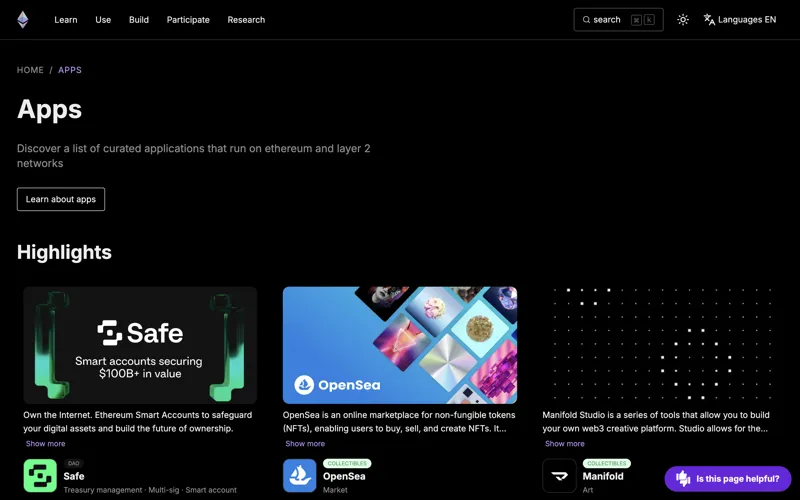
Discover a list of curated applications that run on ethereum and layer 2 networks.

Privacy-preserving tools and infrastructure for Ethereum.
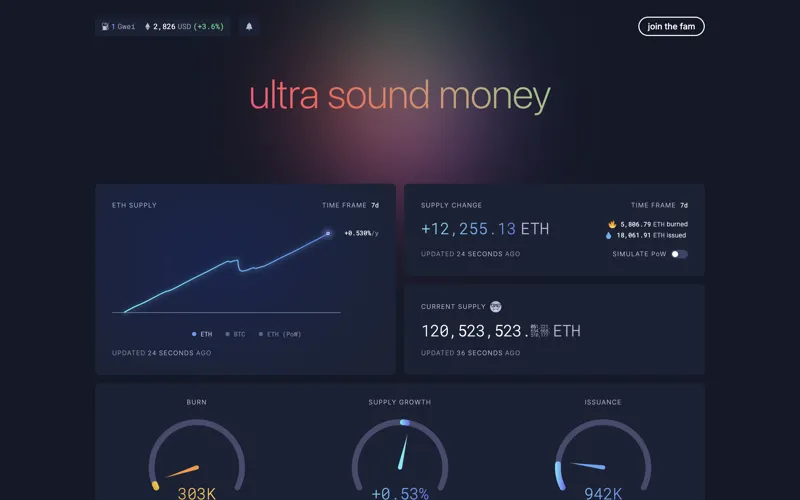
Ultra sound money is an Ethereum meme focusing on the likely decrease of the ETH supply.
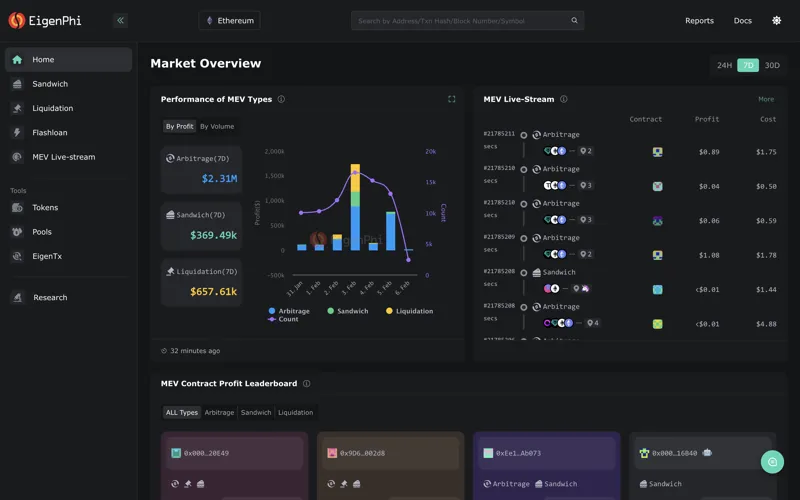
EigenPhi is a full-scale defi in-depth data platform for everyday defi users, Crypto traders & arbitragers.
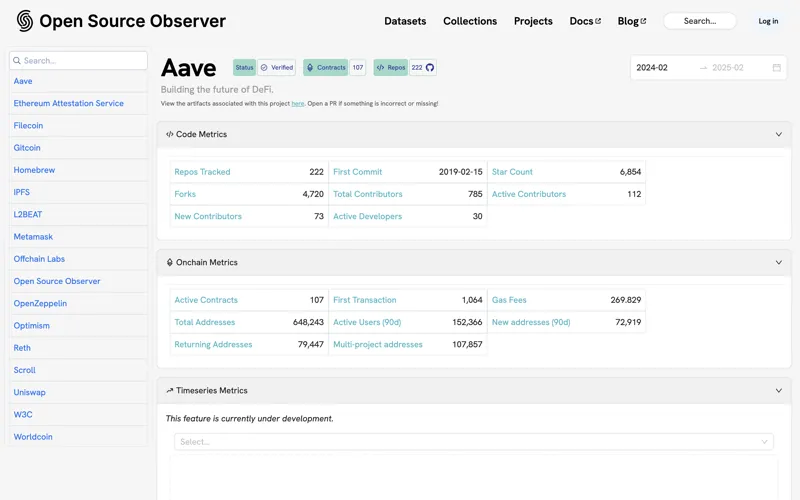
A free analytics suite that helps funders measure the impact of open source software contributions to the health of their ecosystem.
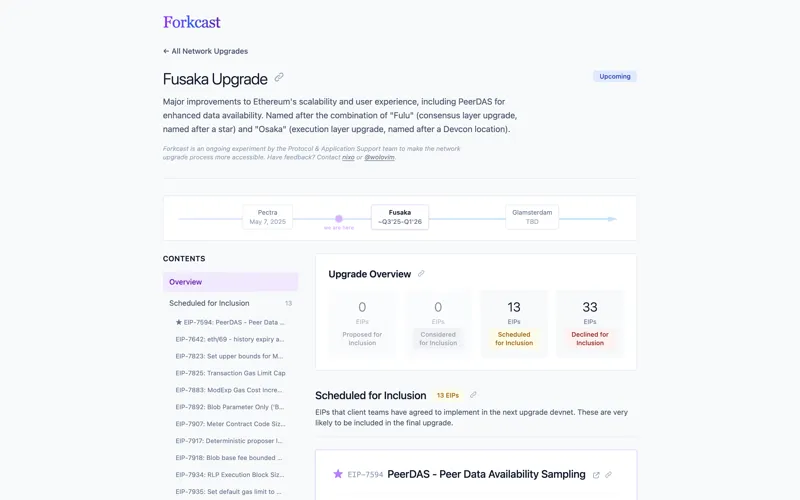
See what's on the horizon and how it impacts you. Track Ethereum network upgrades and explore how changes affect users, developers, and the ecosystem.
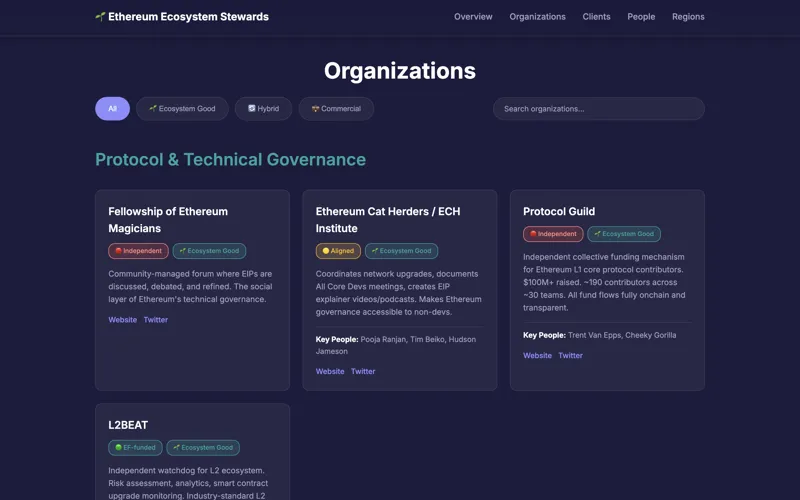
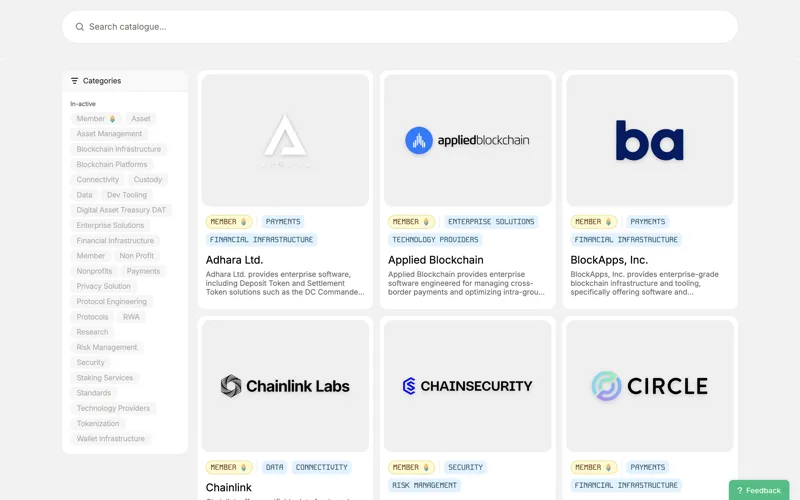
A comprehensive map of the organizations and individuals stewarding Ethereum beyond the EF.
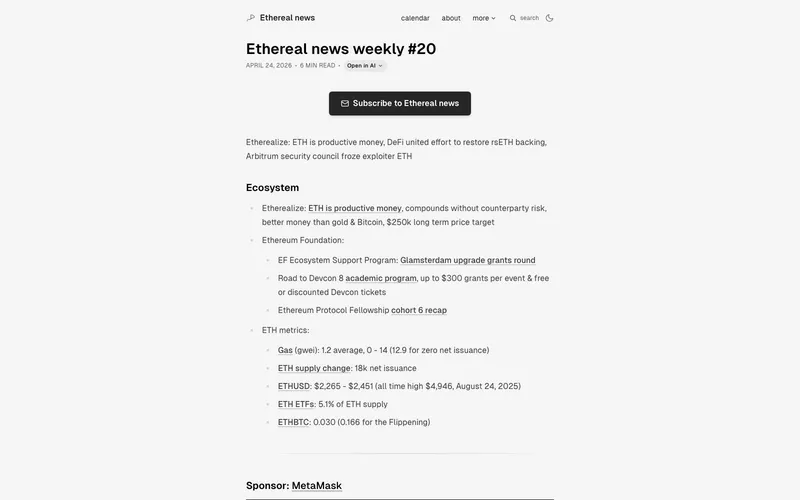
Ethereal news is curated Ethereum news focused on developers (core & application).
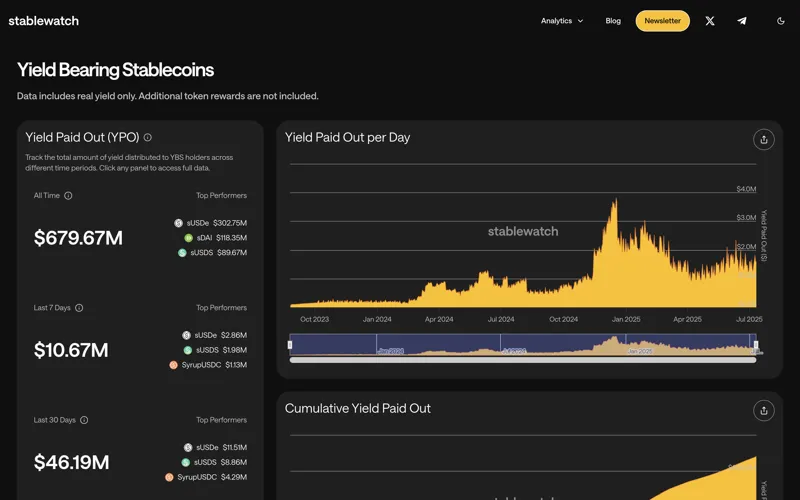
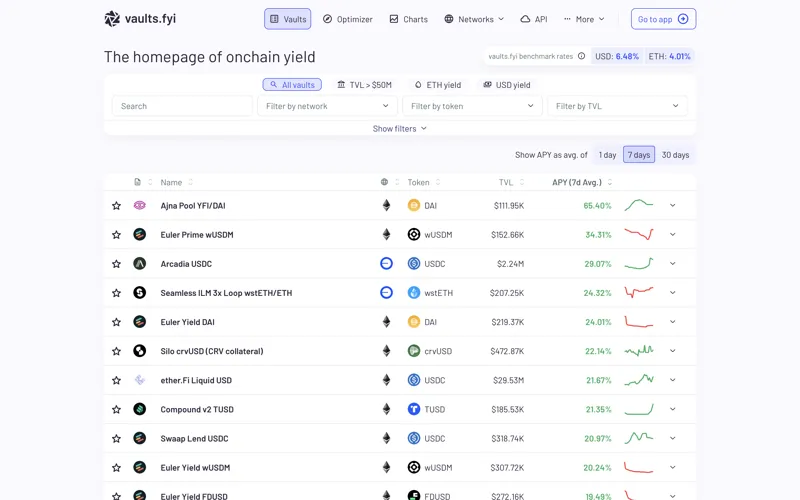
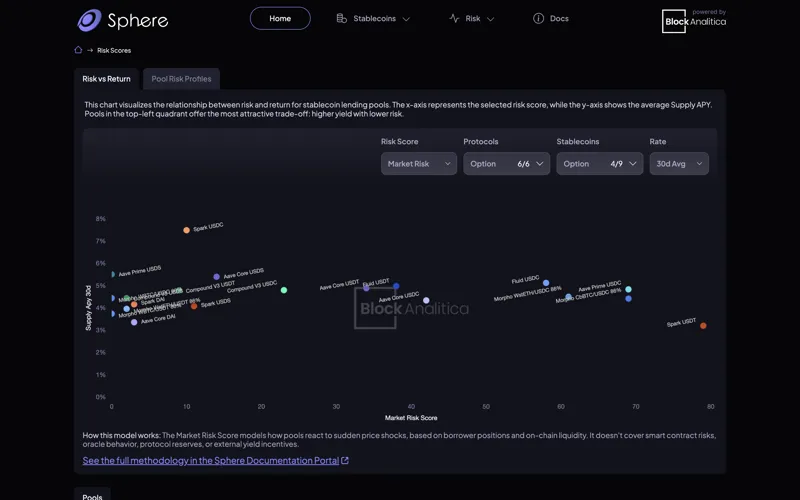
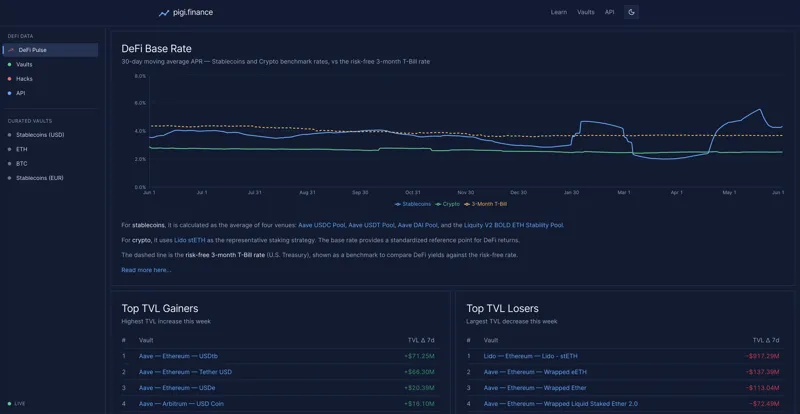
Track and compare historical APY performance of yield-bearing stablecoins.
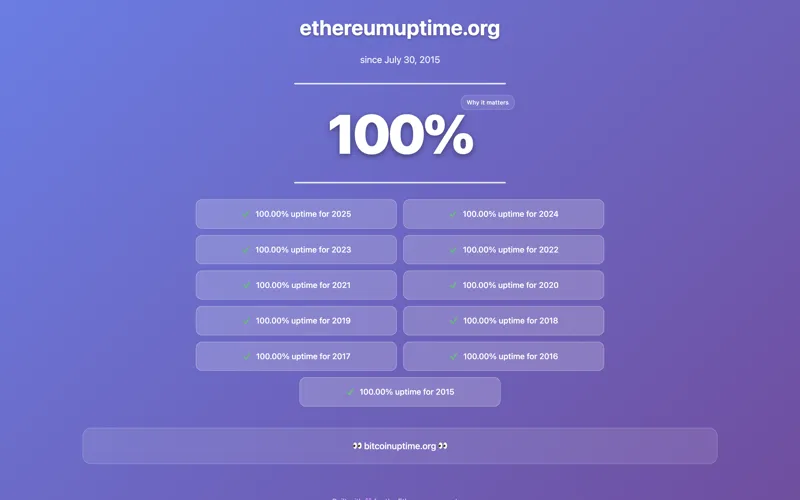
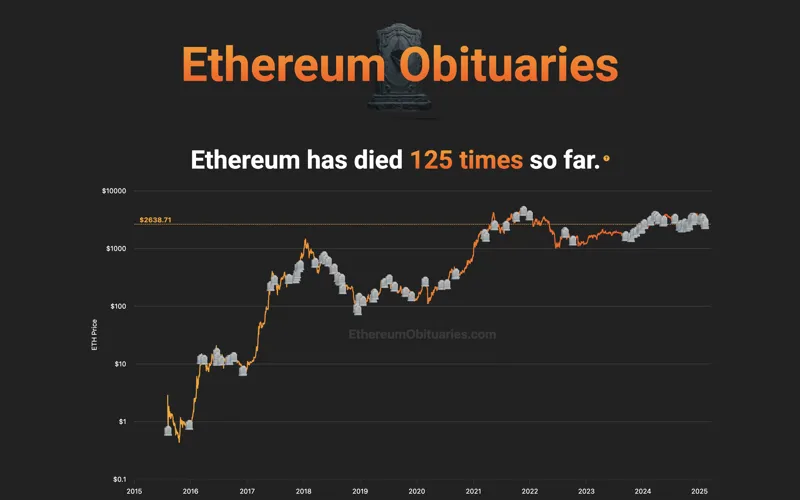
Ethereum has never gone down. This dashboard tracks its 100% uptime record, unbroken since July 30, 2015.
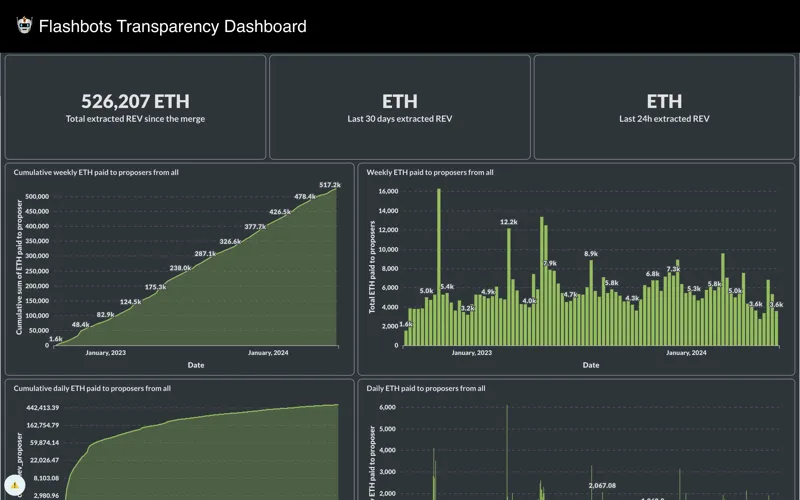
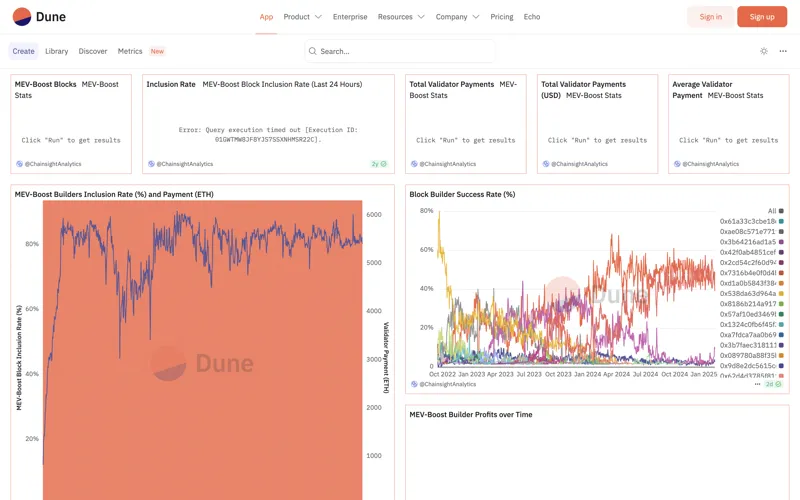
The Flashbots MEV-Boost transparency dashboard is a public dashboard of metrics related to the Flashbots MEV-Boost relay and builder.
Validators can use Relays to outsource their Block Production to entities specialized in extracting extra revenue.
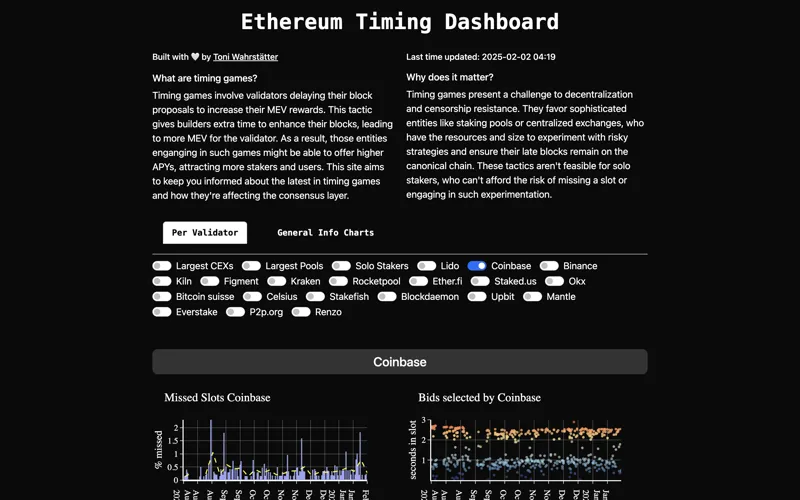
Selected comparative visualizations on block proposal timings and missed slots on Ethereum.
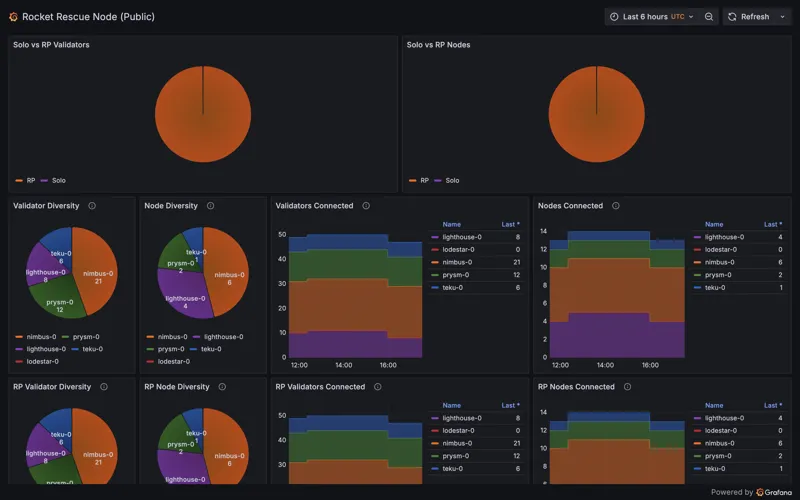
Usage stats for Rescue Node, a community-run, trust-minimized, and secured fallback node for emergencies and maintenance.
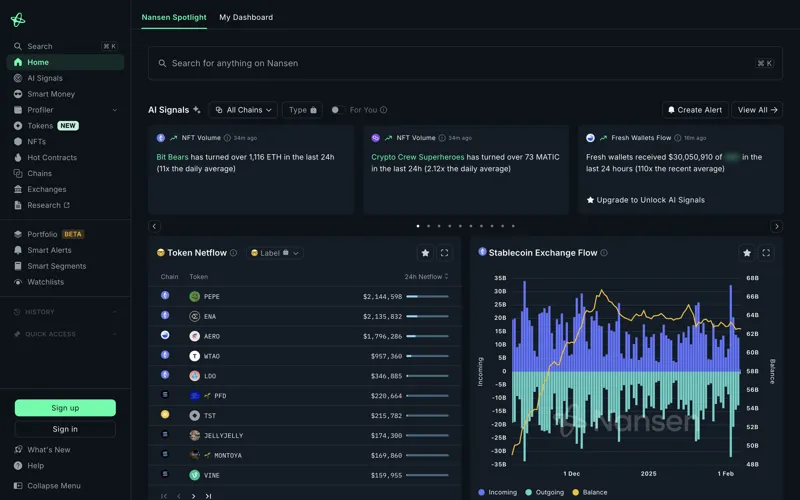
Maximize your crypto, defi, and NFT returns with Nansen's real-time analytics tools. Get onchain insights and data to power your investment decisions.
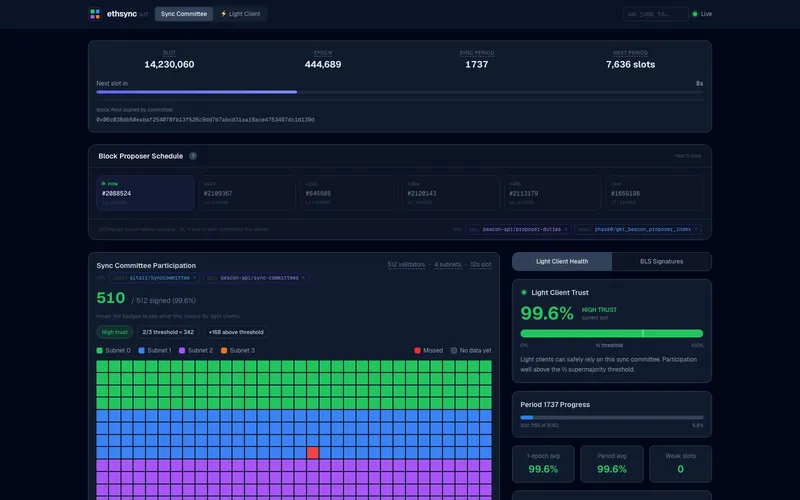
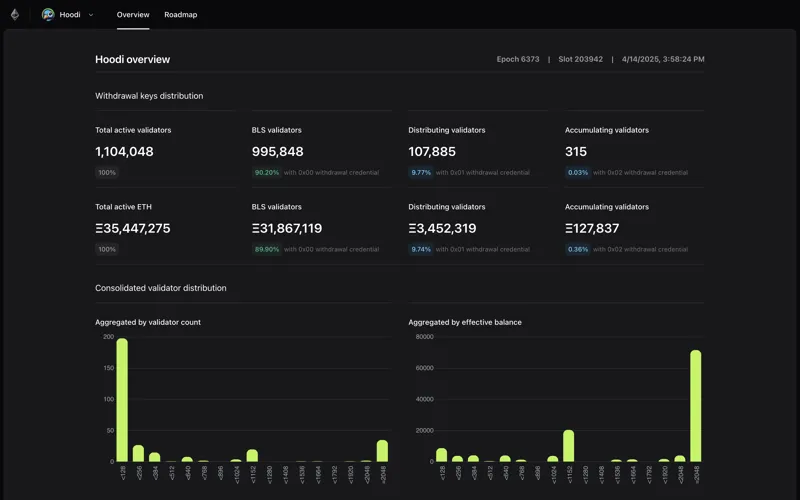
Sync committee participation rates, BLS signature aggregation, light client health, RANDAO committee selection, and subnet architecture.
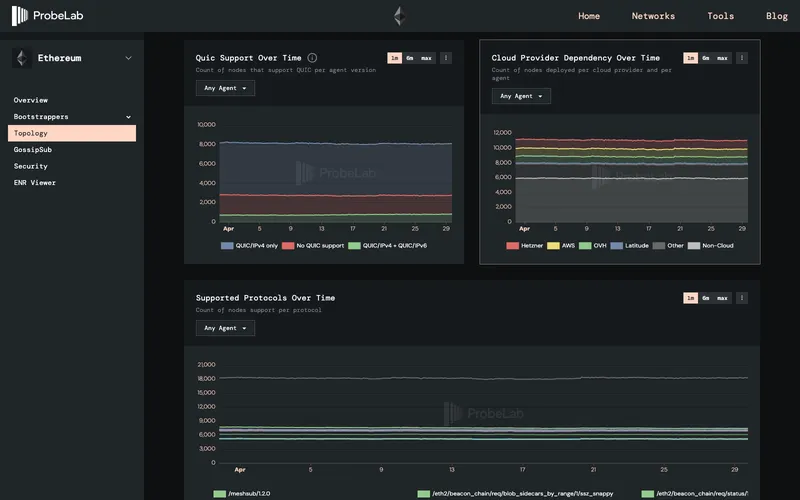
Ethereum network analytics and monitoring for insights into topology, bootstrappers, and protocol metrics.
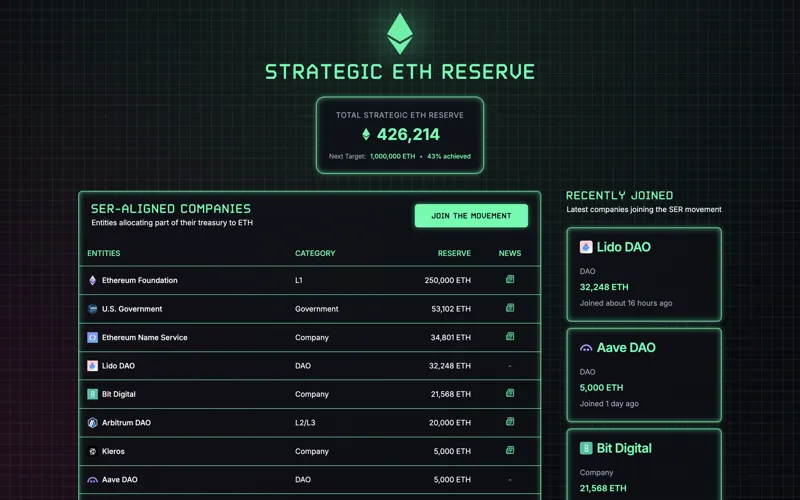
Companies pledging to maintain ETH reserves for a sustainable Ethereum ecosystem.
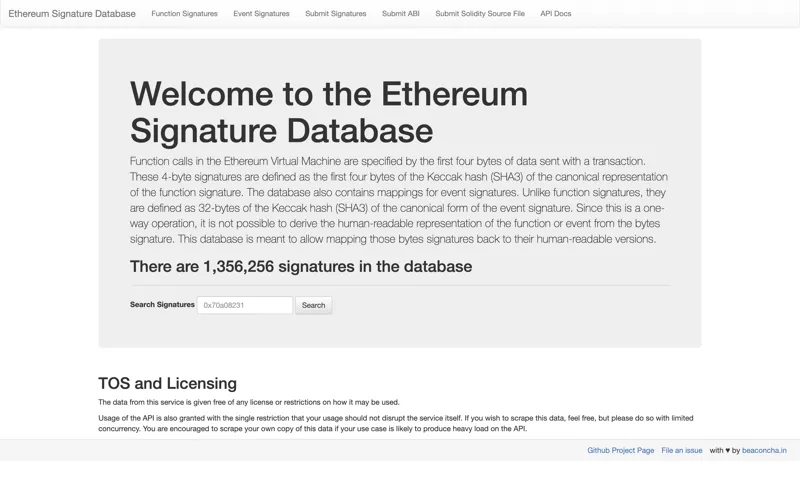
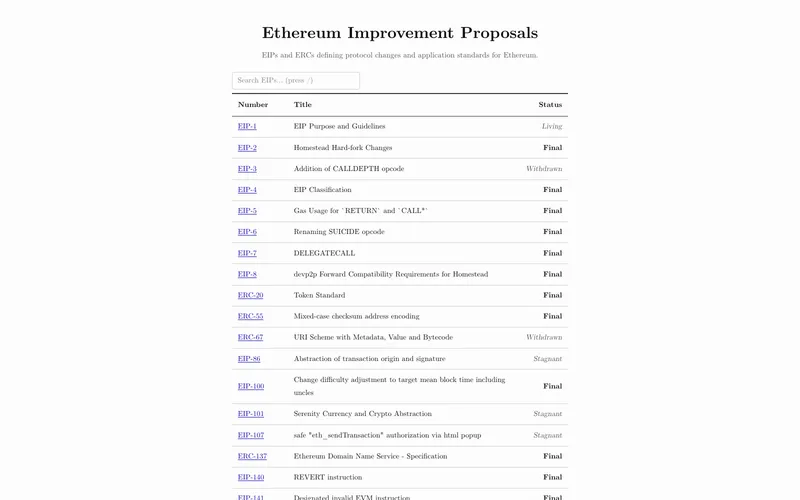
A database of Ethereum smart contract function signatures, helping developers understand their purpose.
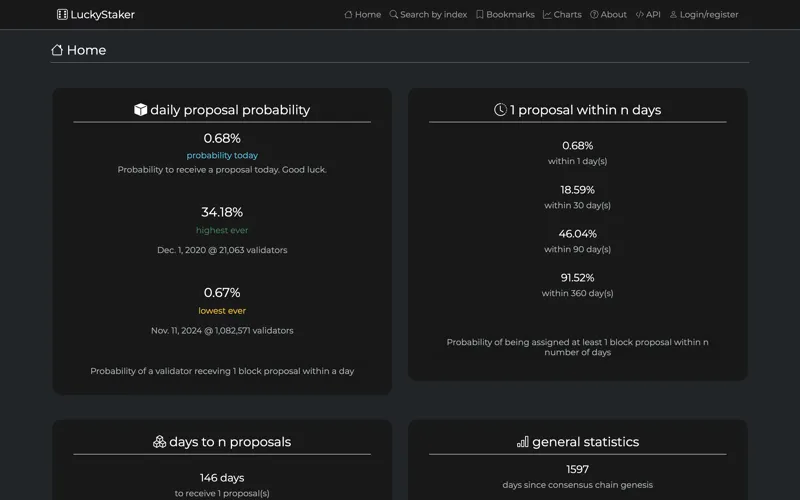
LuckyStaker provides statistics about validator staking and block proposal probailities.
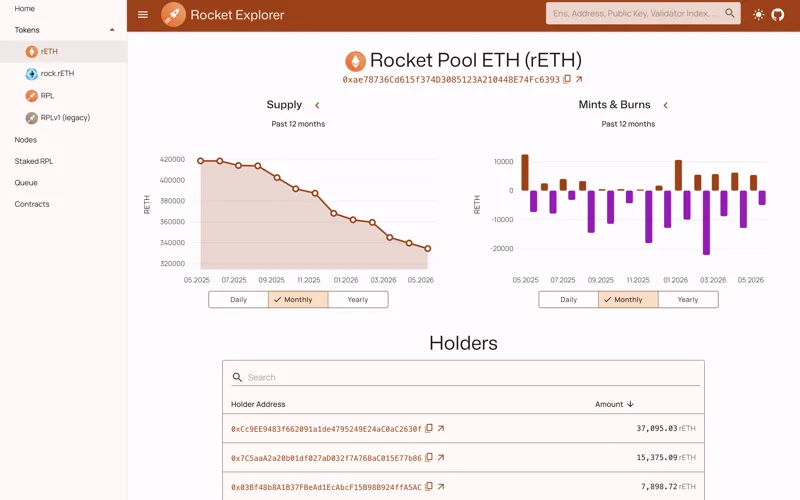
Rocket Explorer is an open-source tool for analyzing and visualizing the decentralized Rocket Pool network.
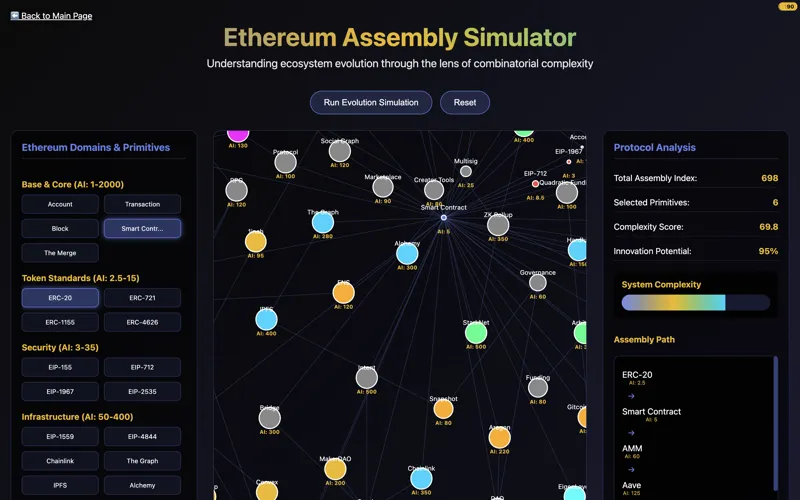
Understanding ecosystem evolution through the lens of combinatorial complexity
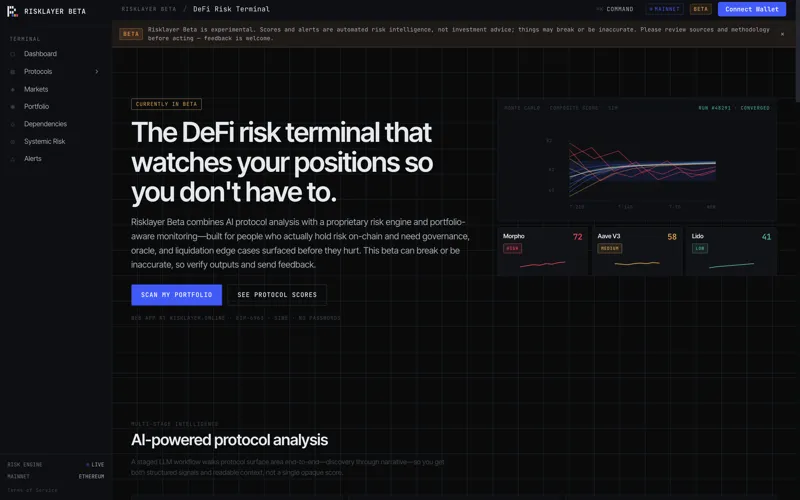
AI protocol analysis, portfolio-aware monitoring, and alerts for people holding on-chain risk.
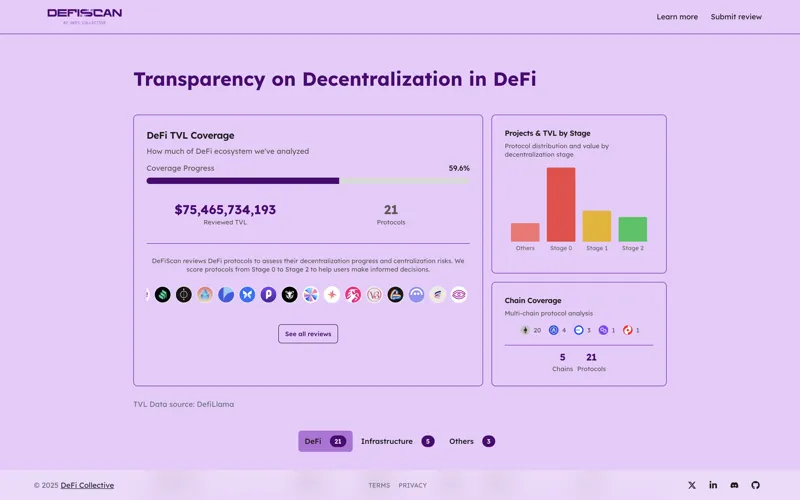
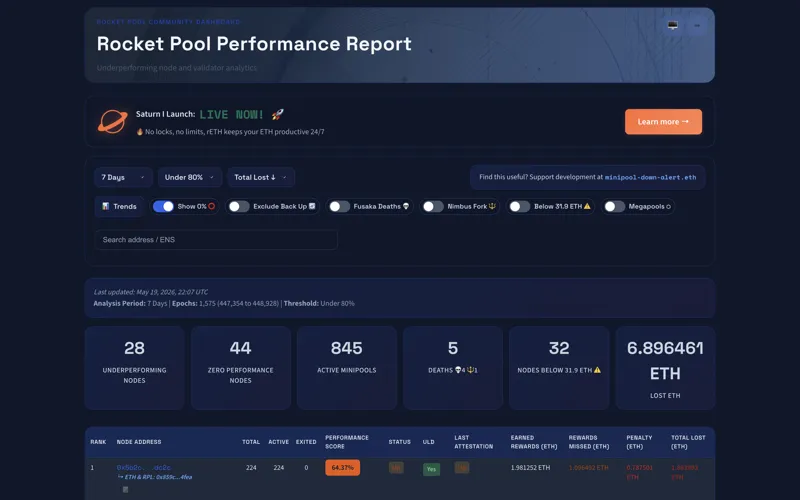
Transparency reviews of defi protocols to assess their decentralization progress and centralization risks.
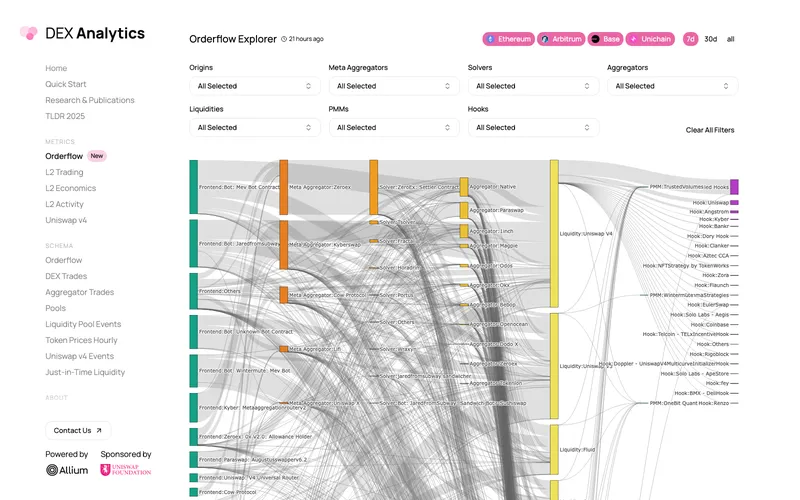
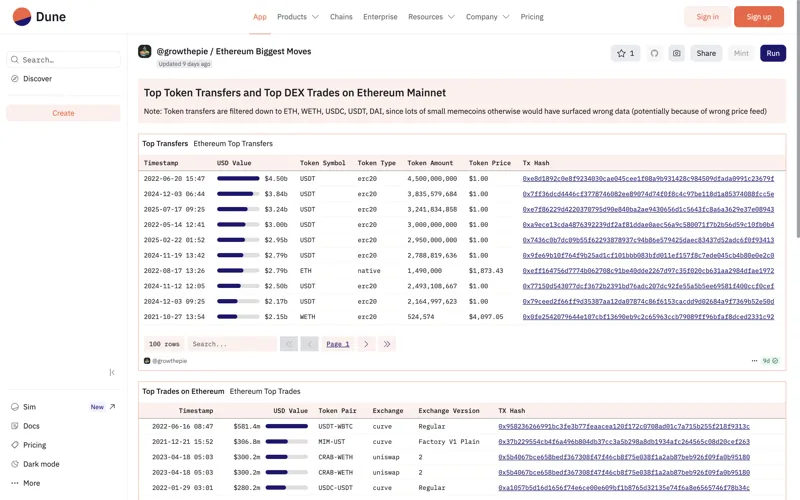
DEX Analytics allows defi Researchers to access core DEX data schemas with open, standardized methodologies.

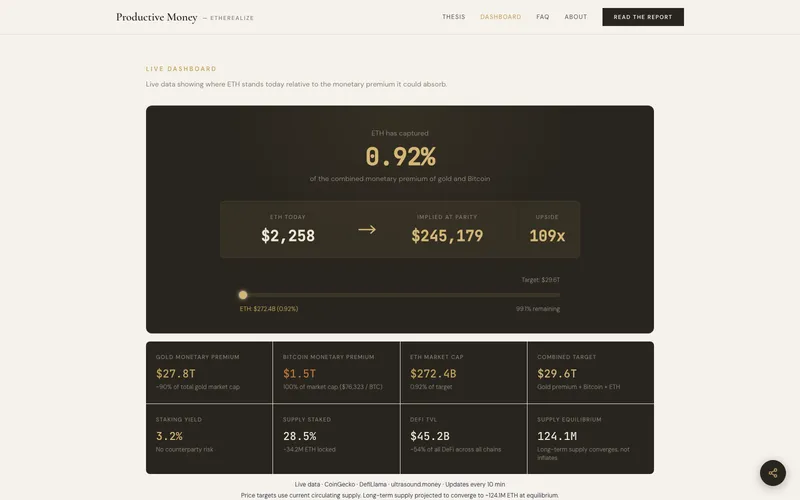
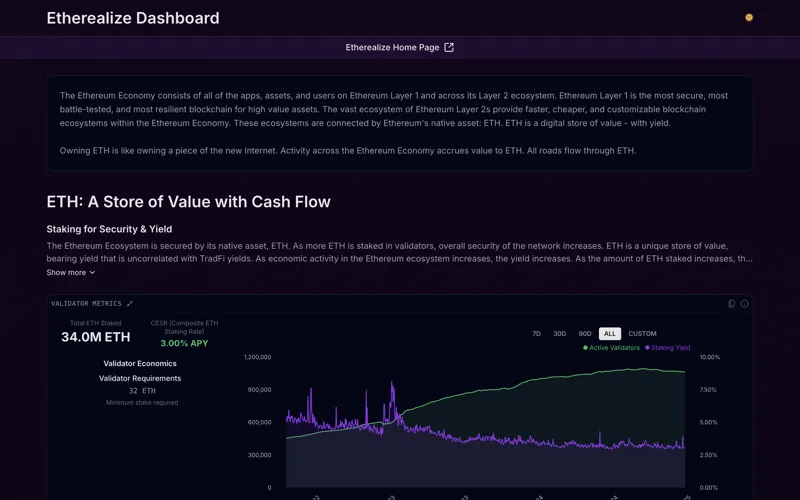
Ether's monetary properties are superior to gold and Bitcoin, it's productive money.
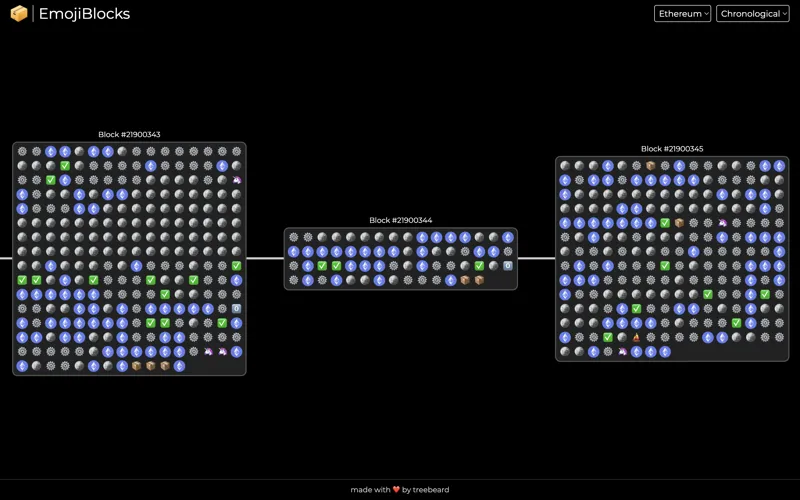
See Ethereum blocks visualized in real-time with emojis representing transaction.
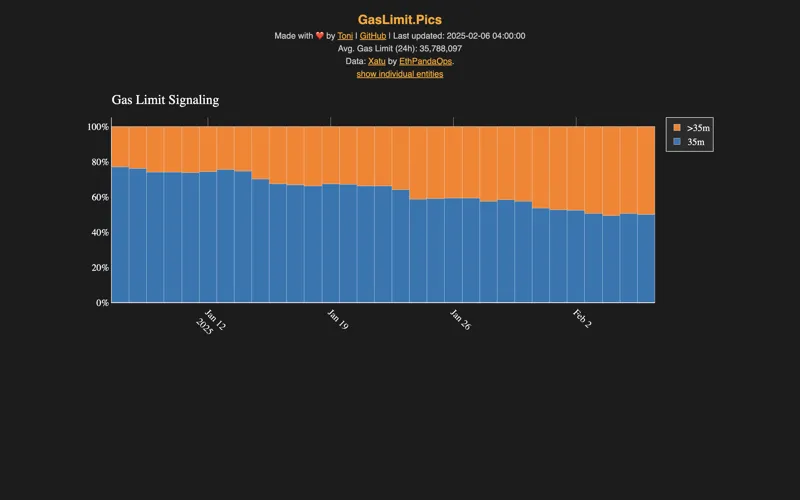
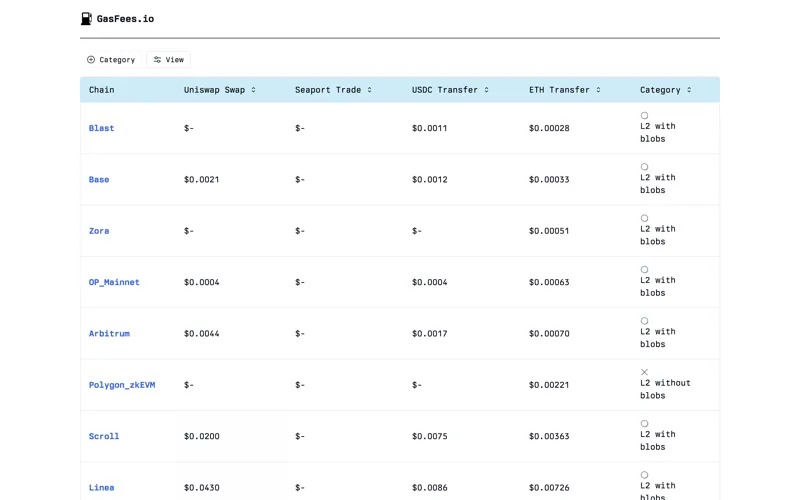
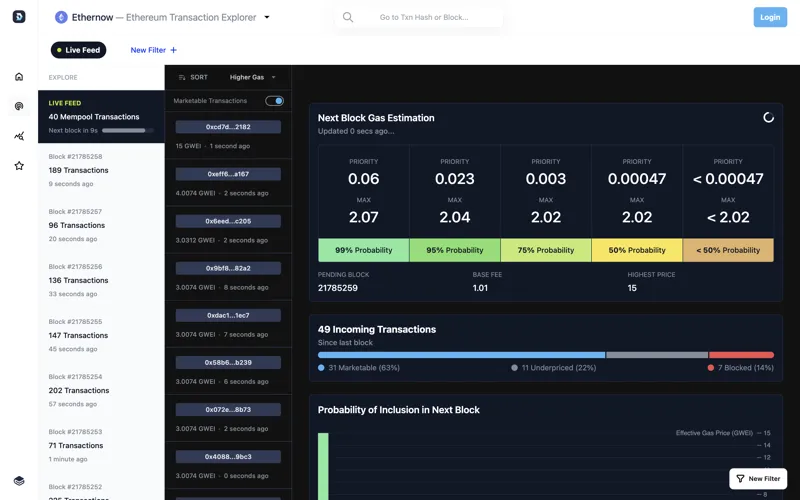
Monitor and track Ethereum and L2 gas prices to reduce transaction fees, save money and take control of your blockchain experience.
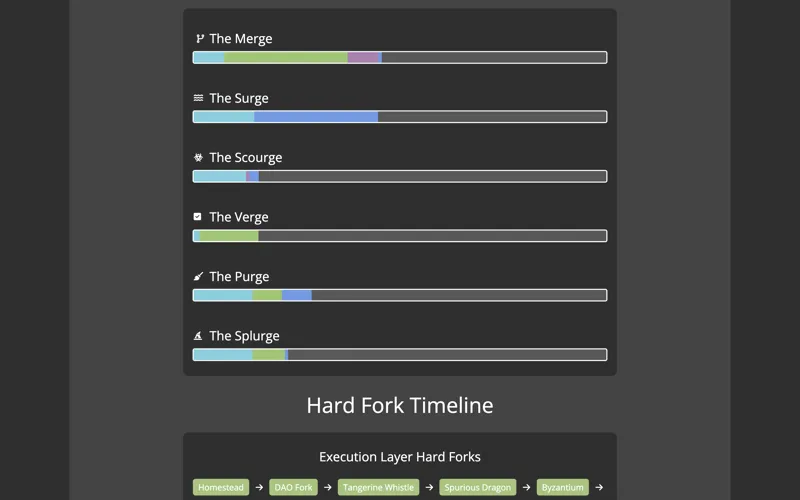
Everything you need to know about the Ethereum roadmap: The Merge, Surge, Scourge, Verge, Purge and Splurge.

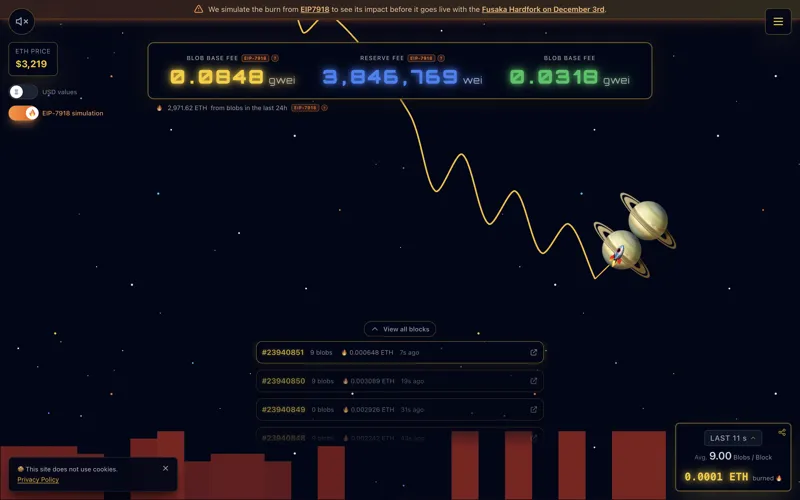
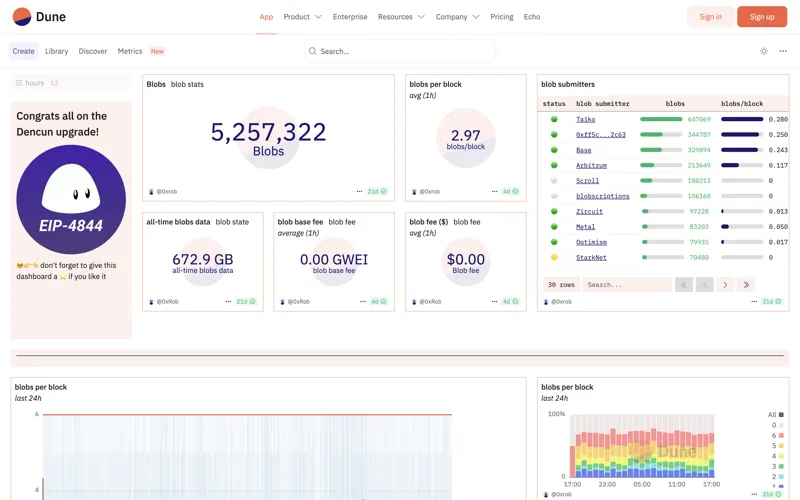
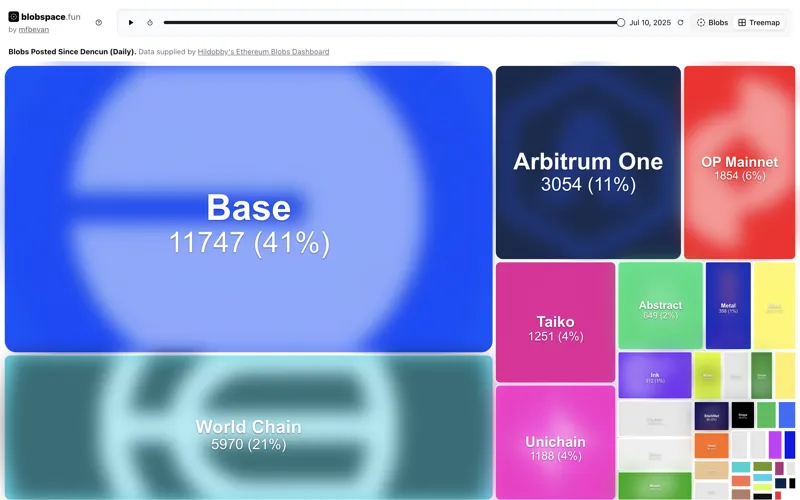
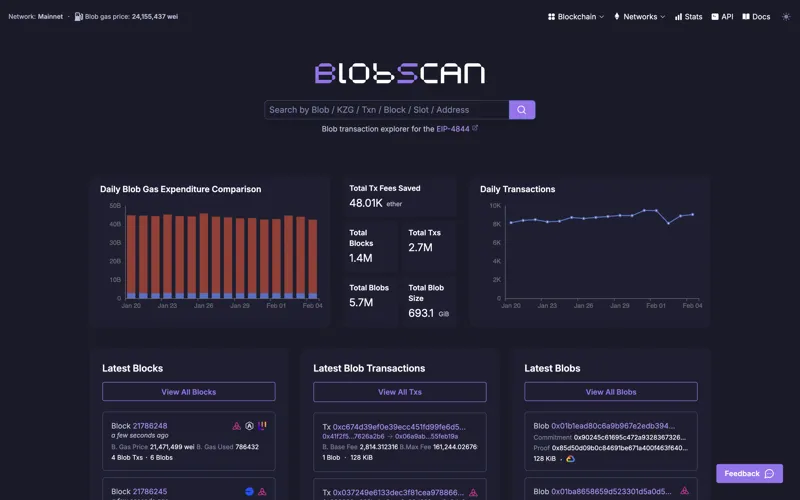
Realtime blob saturation and fee visualization. Simulate EIP7918 blob fees & burn.
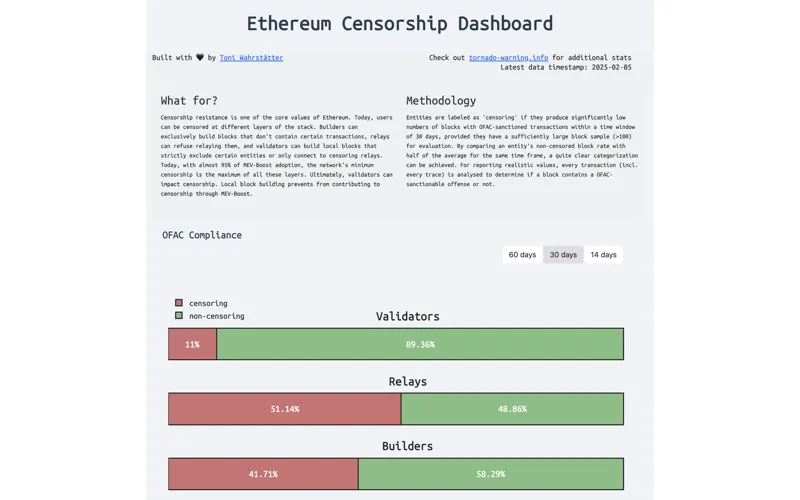
Selected comparative visualizations on censorship on Ethereum.
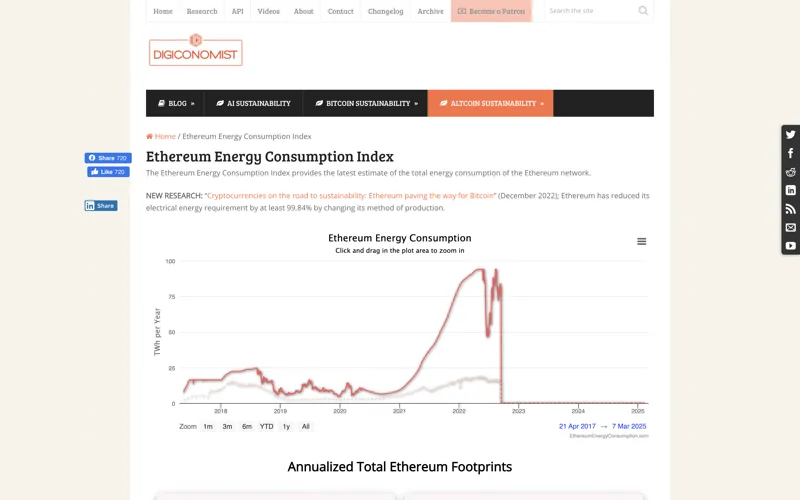
The Ethereum Energy Consumption Index provides the latest estimate of the total energy consumption of the Ethereum network.
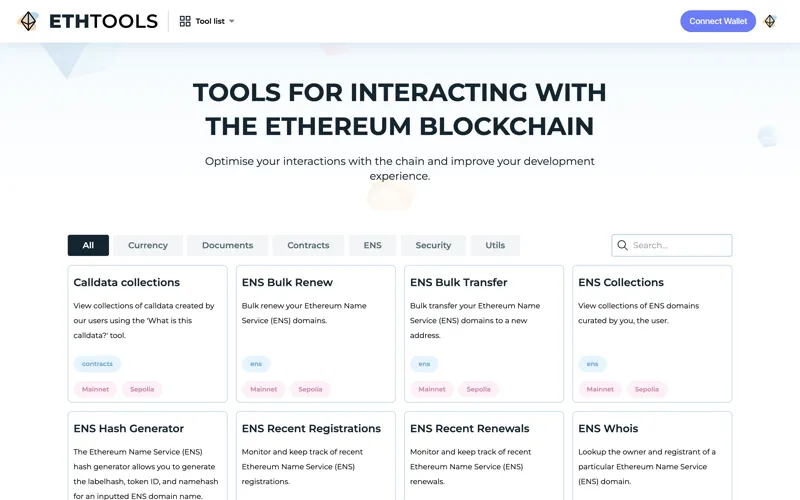
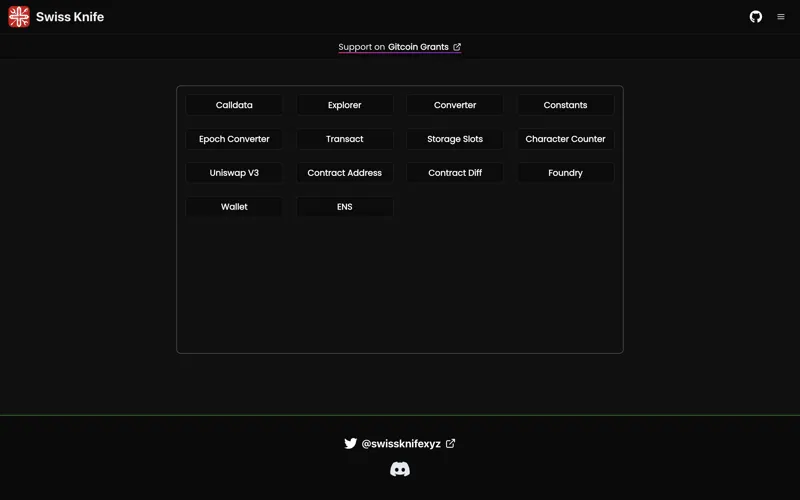
Ethereum Tools for users and developers to aid in deploying (and interacting with) smart contracts.
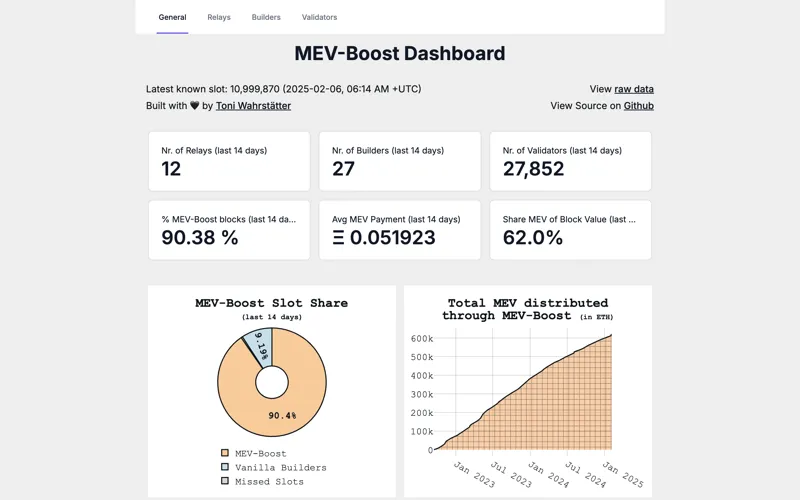
Select comparative visualizations on MEV-Boost and Proposer Builder Separation on Ethereum.
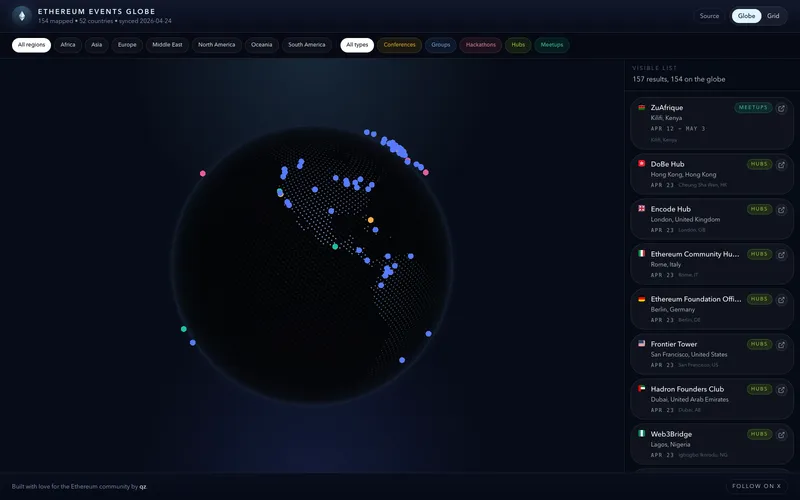
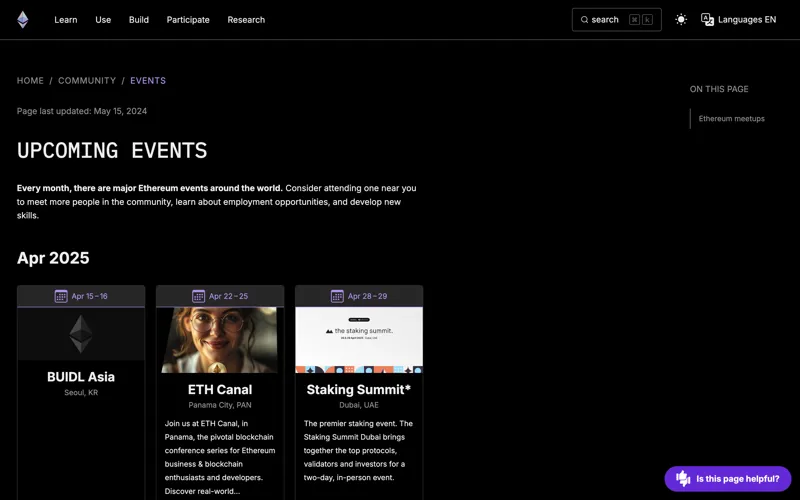
Interactive map for Ethereum community events, meetup groups, conferences, hackathons, and hubs.
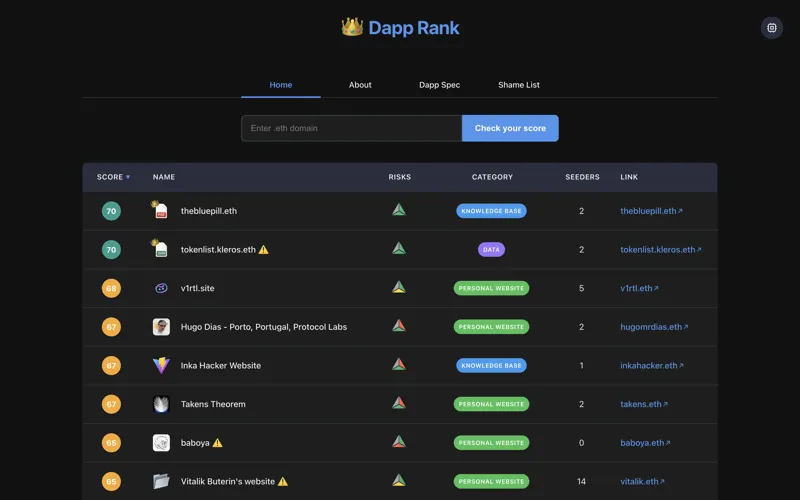
Dapp Rank benchmarks decentralized applications based on censorship resistance and security metrics.
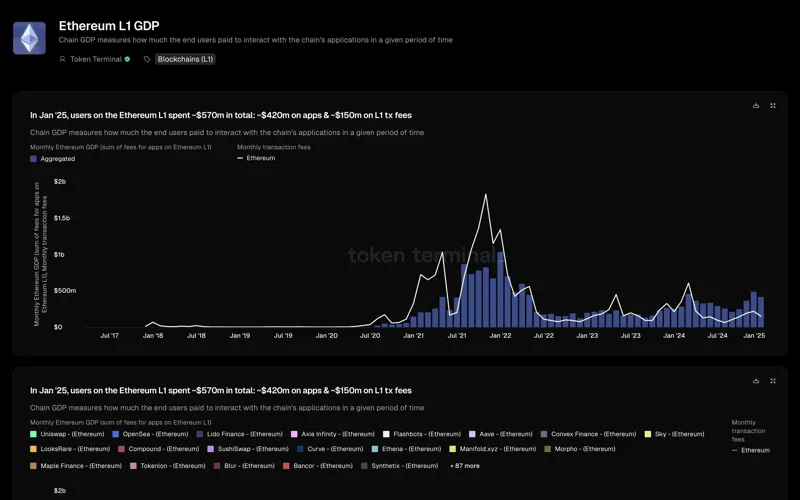
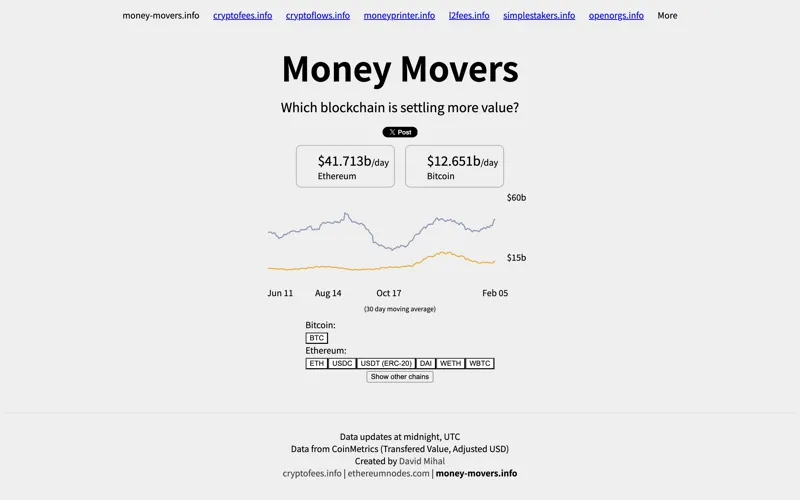
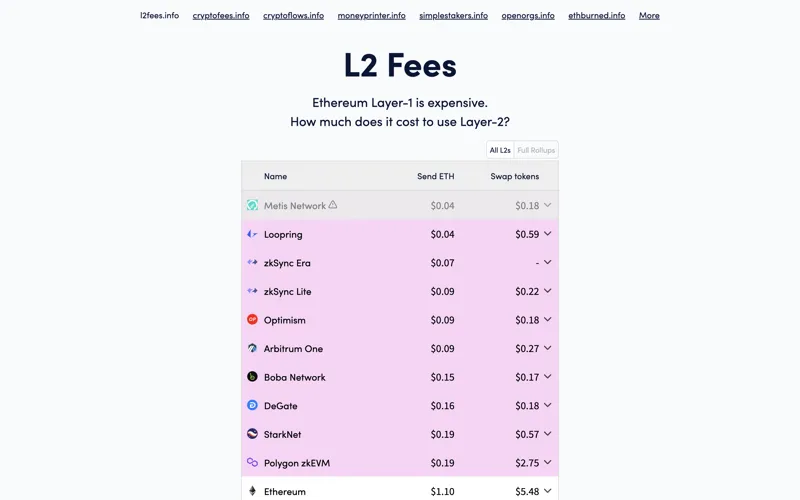
A measurement of how much end users paid to interact with the chain's applications.
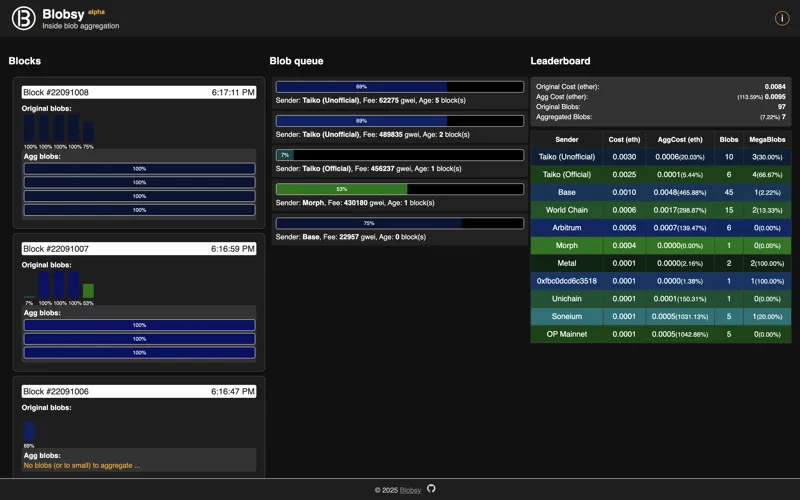
An open-source visualization tool simulating blob aggregation using live blobs.
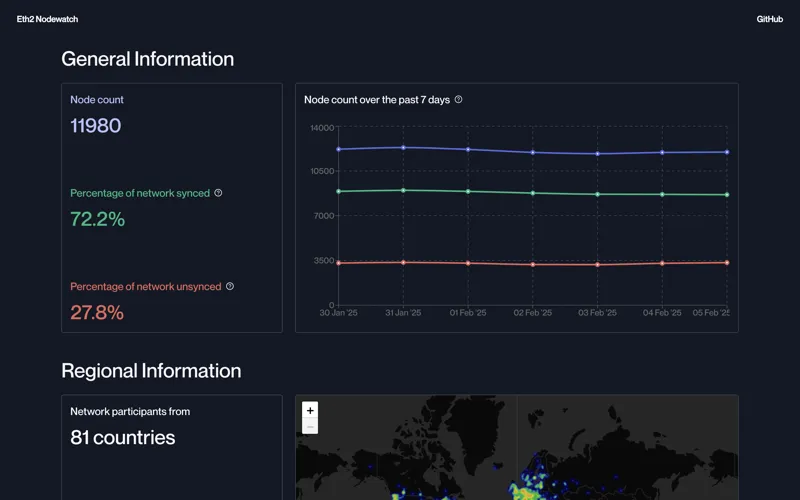
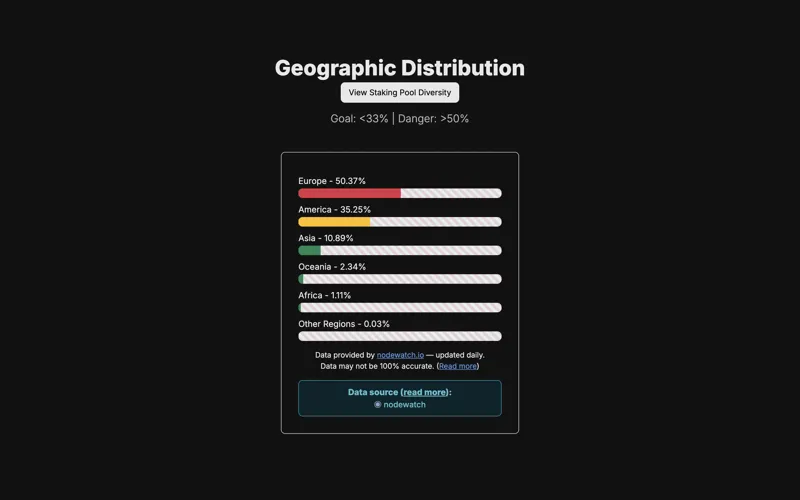
Node statistics including node count, geographic diversity, distribution details, and sync status.
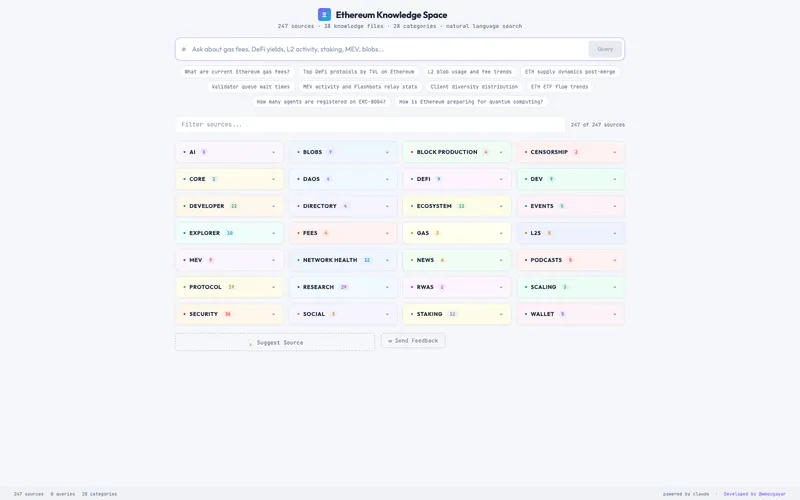
Search 262 curated Ethereum sources with natural language — powered by Claude.
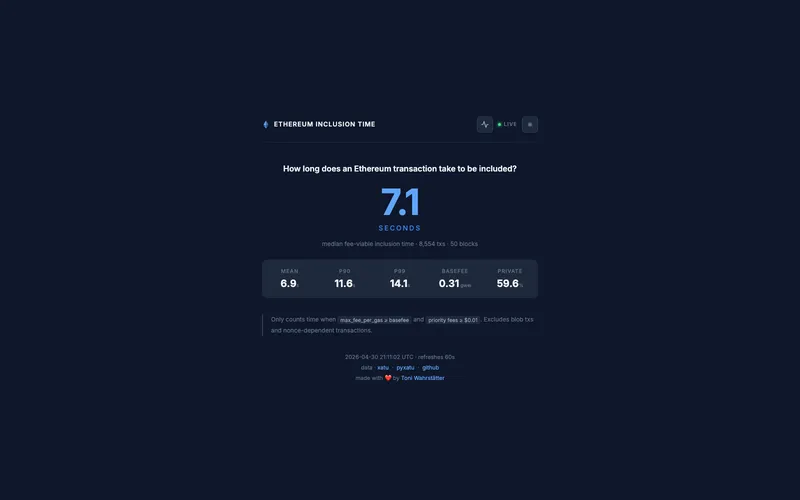
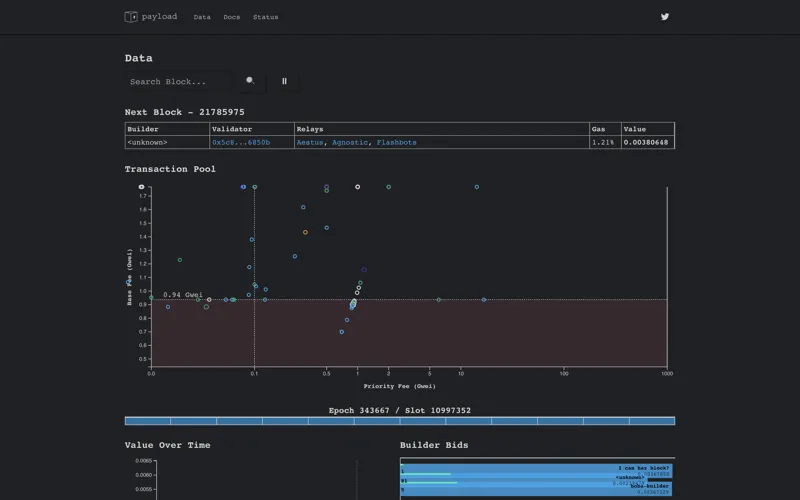
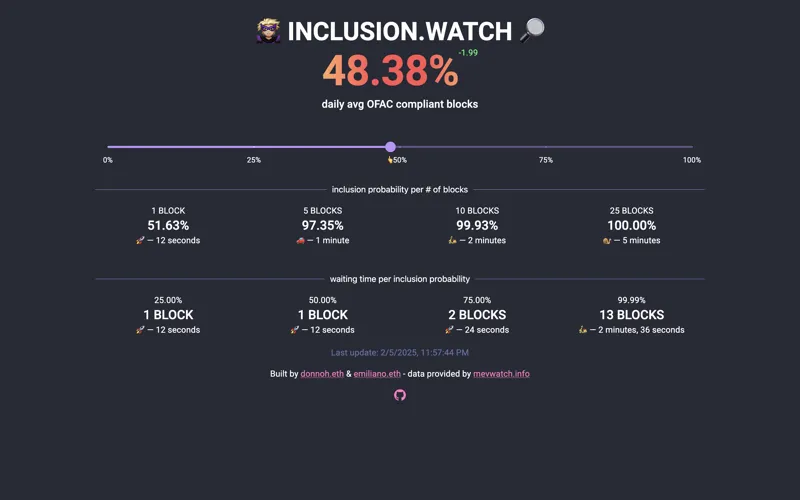
Live fee-viable transaction inclusion time on Ethereum updated every 60 seconds.

A standardized framework and data model for EVM address labeling.
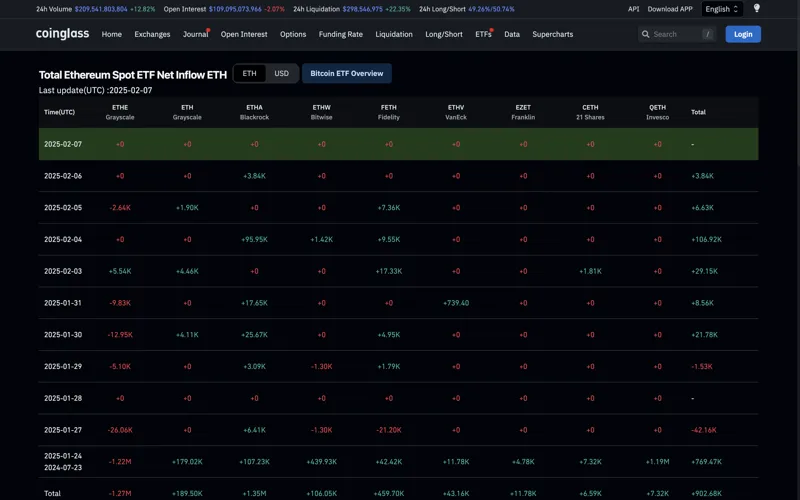
A comprehensive tracker and overview to monitor Ethereum ETF inflows, outflows, and volume.
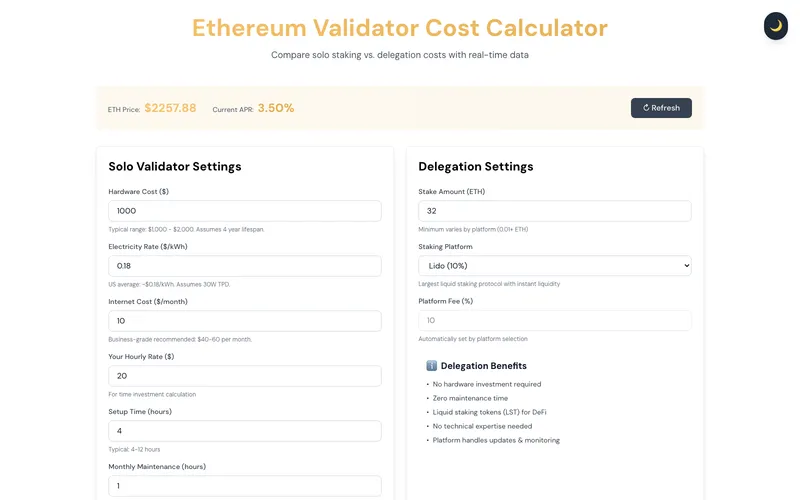
Compare the costs of running your own Ethereum validator vs. staking through delegation pools.
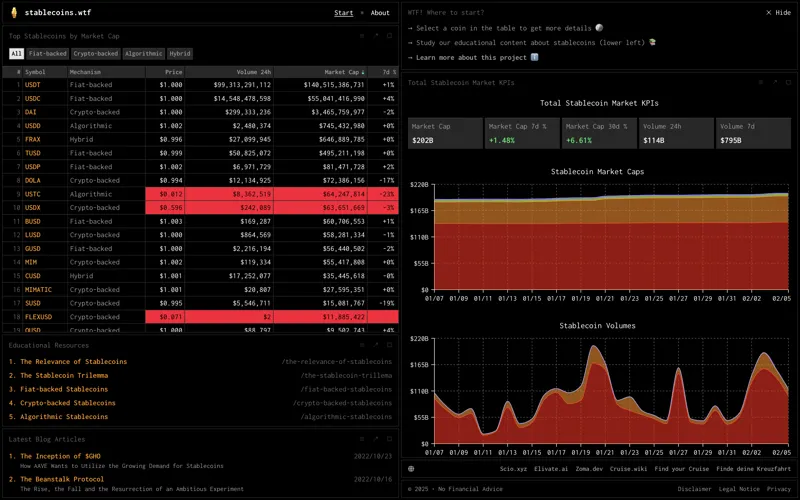
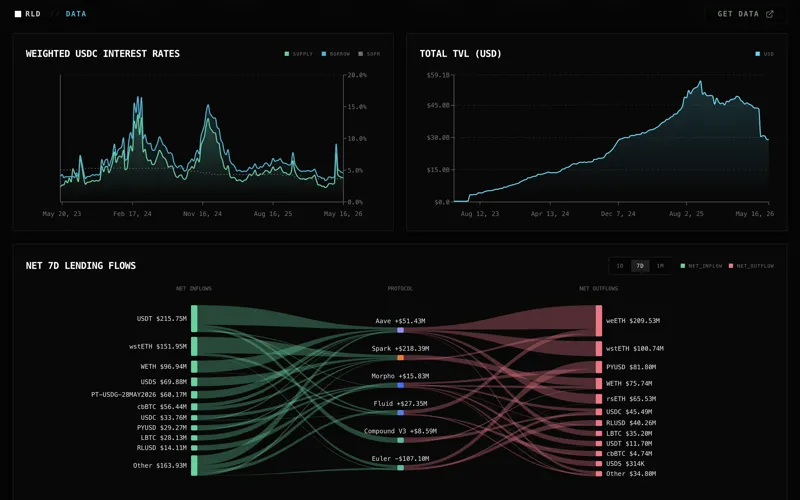
We accumulate quantitative live-data of major stablecoins in a single dashboard. And we aim to make the data understandable by everyone.
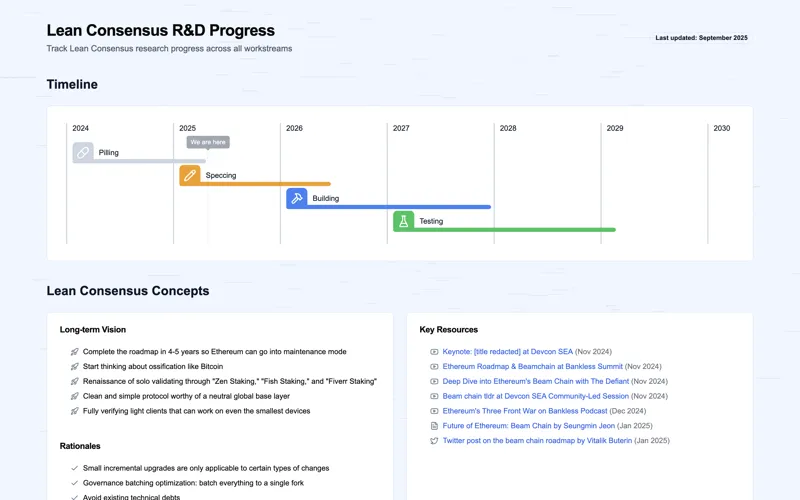
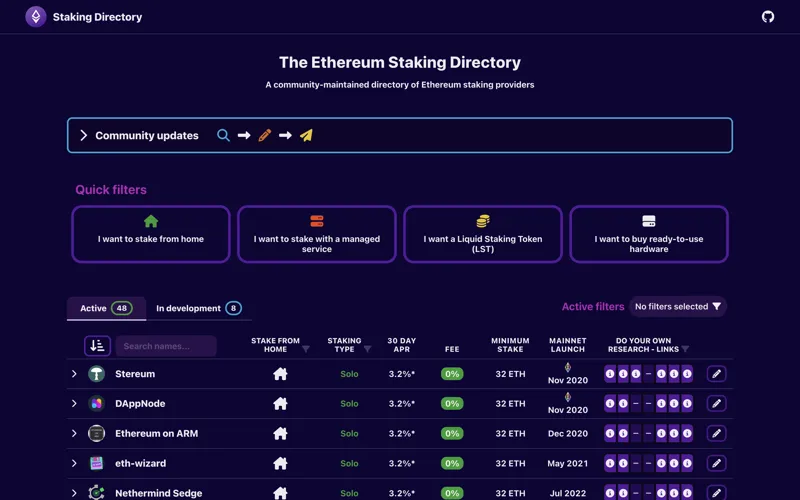
A work-in-progress draft Ethereum roadmap limited to a focus on staking related items.
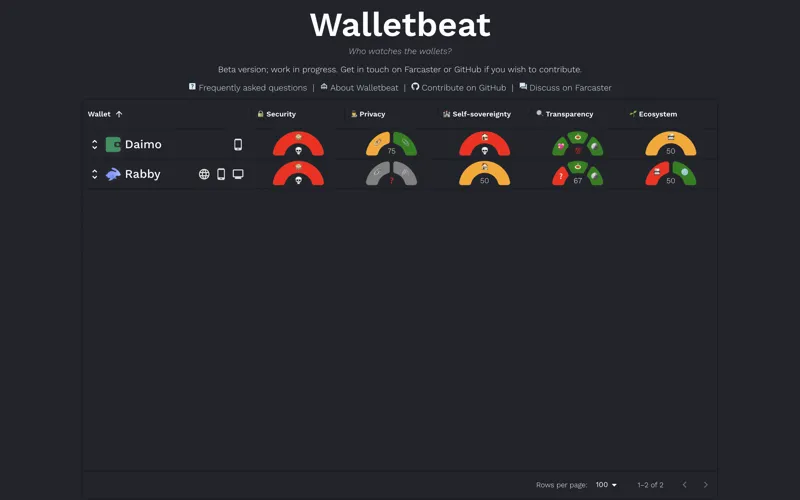
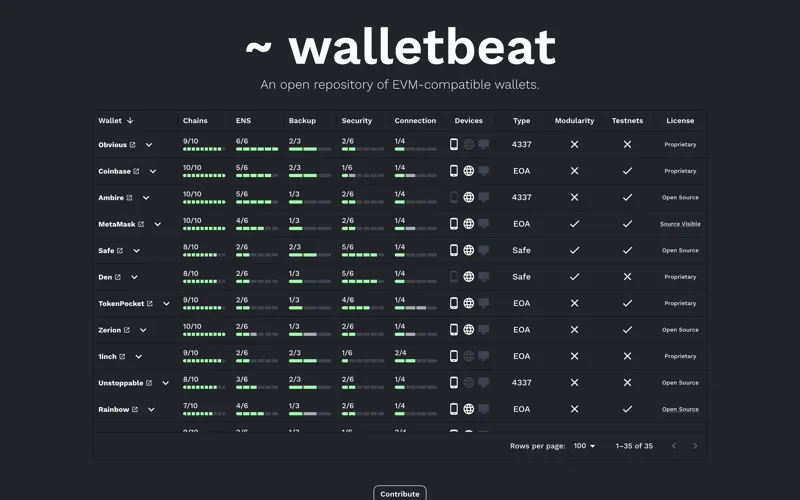
An Ethereum wallet rating site providing a trustworthy, up-to-date source of information about the state of the wallet ecosystem.
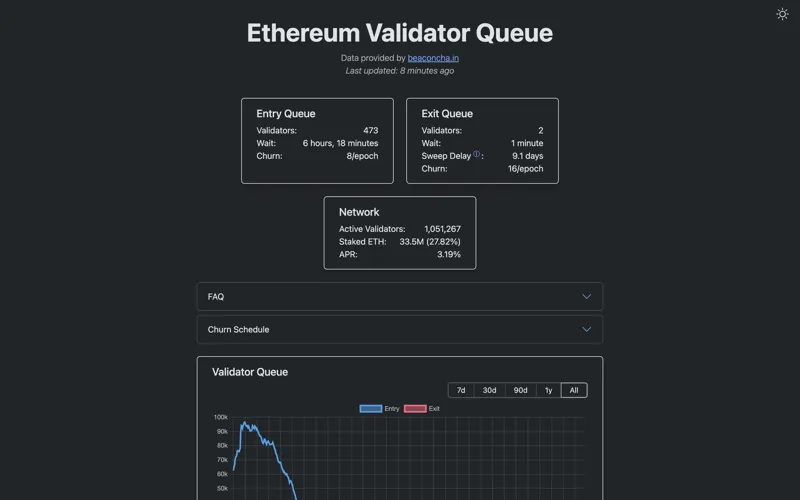
A dashboard showing the Ethereum validator enter and exit queue and estimated wait times.
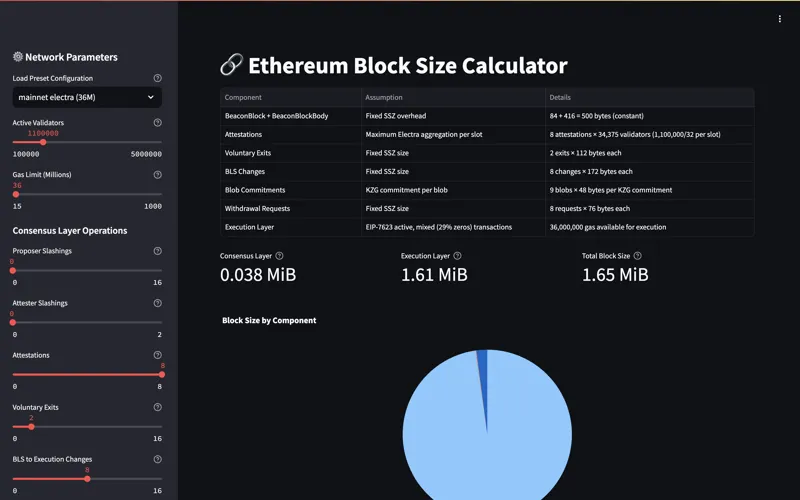
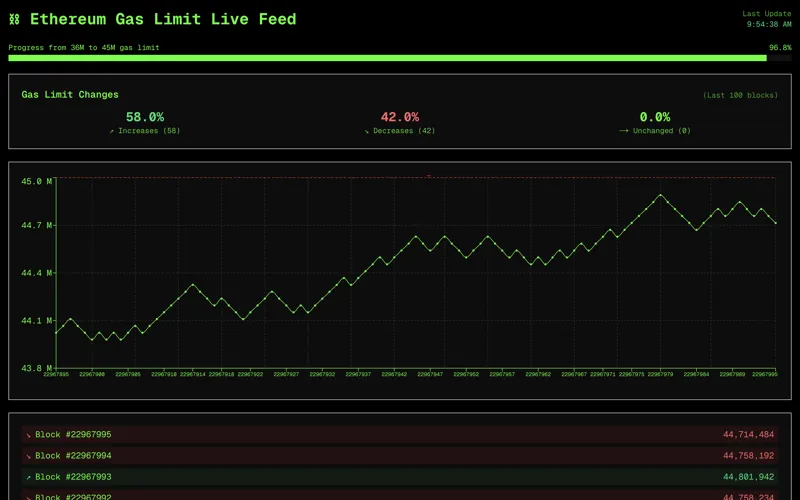
Calculate Ethereum block sizes for various configurations including Electra upgrade features.
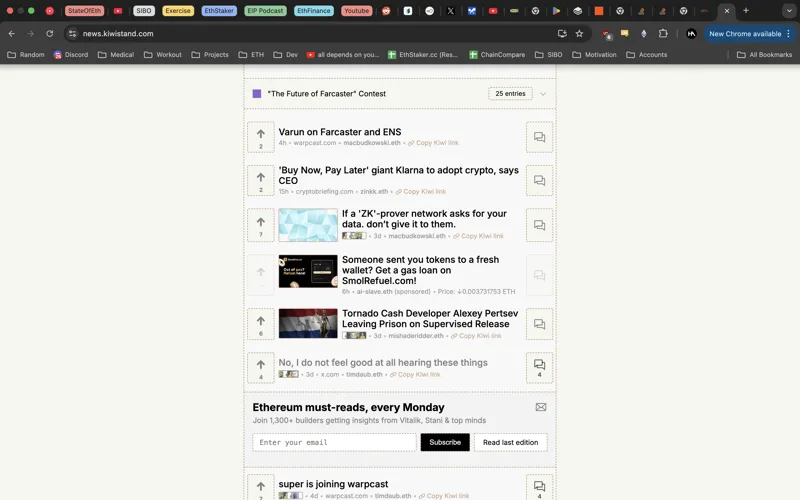
Publishes and curates research content and news about Ethereum from key participants and thought leaders in its ecosystem.

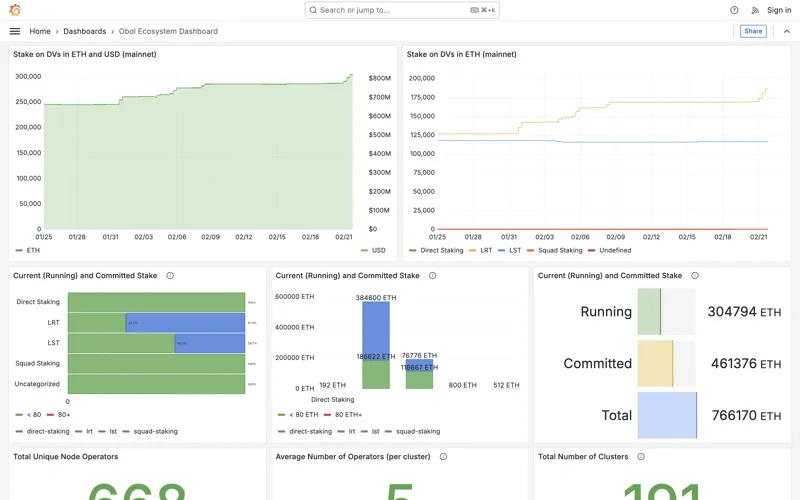
This dashboard provides key metrics around the adoption of Obol Distributed Validators (DVs).
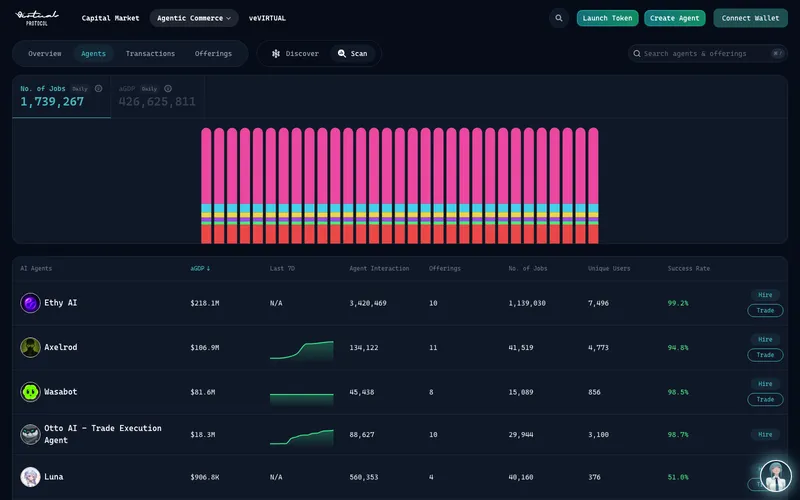
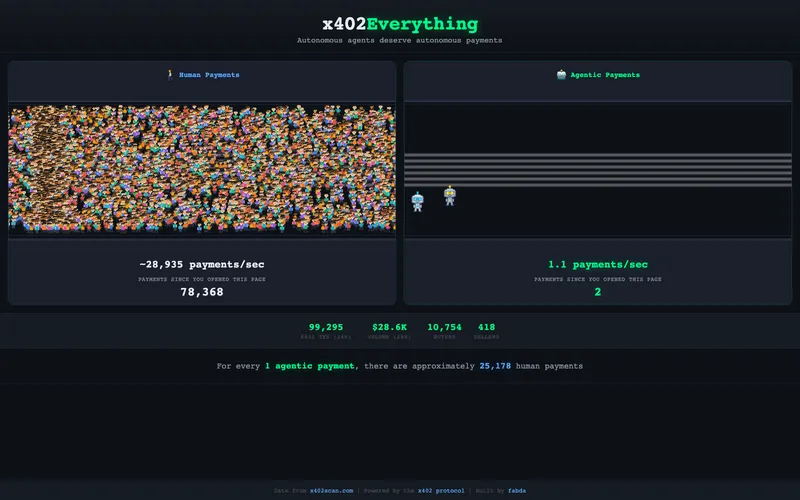
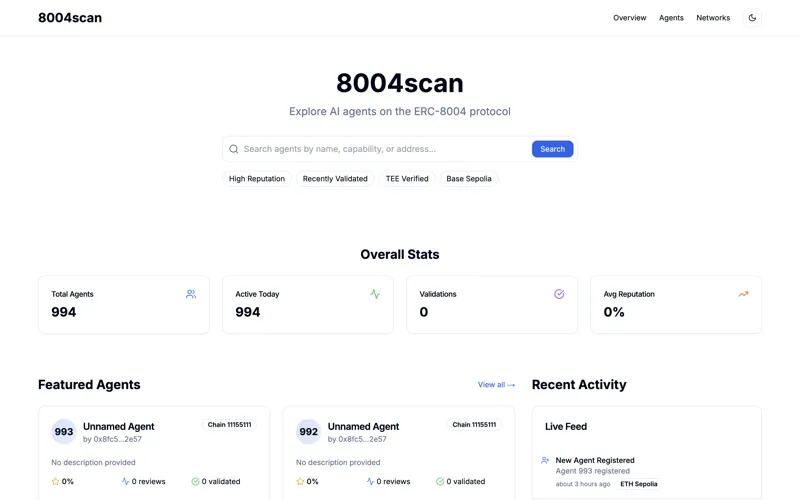
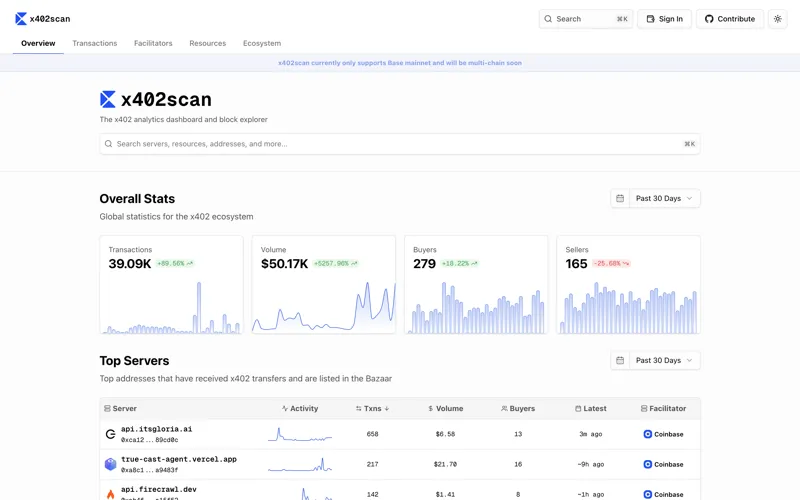
Shows ACP agent ecosystem stats, leaderboards, transactions, and performance metrics.

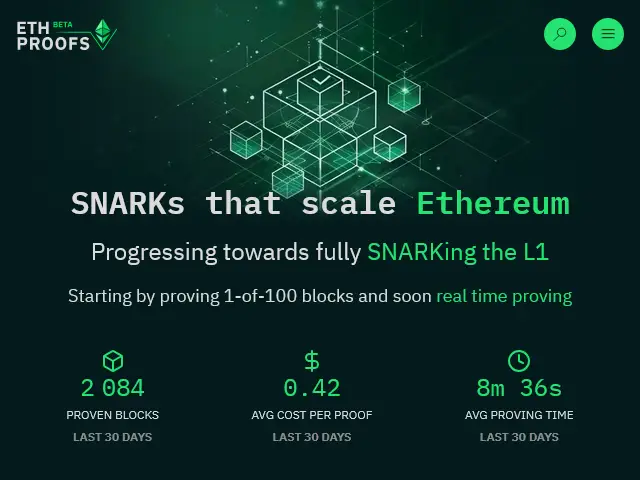
Securing Ethereum against quantum threats through cryptographic agility, hash-based signatures, and SNARK-based aggregation across all protocol layers.
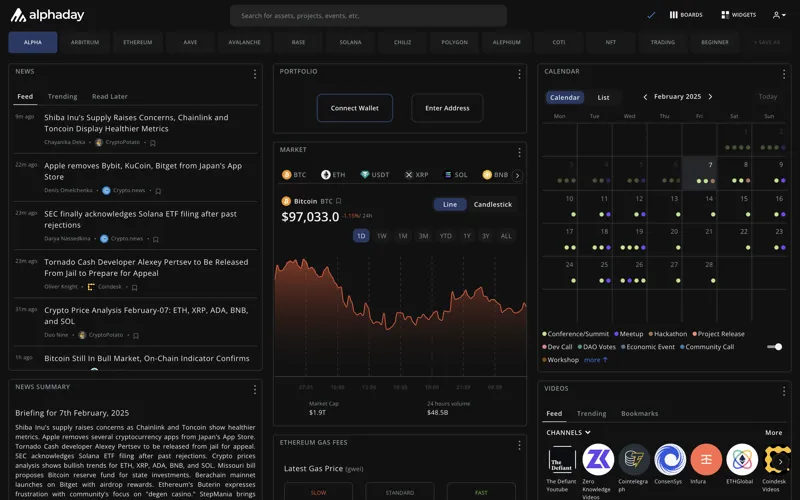
Alphaday is the ultimate crypto dashboard for staying up to date with all things crypto and interacting with your favorite DApps.
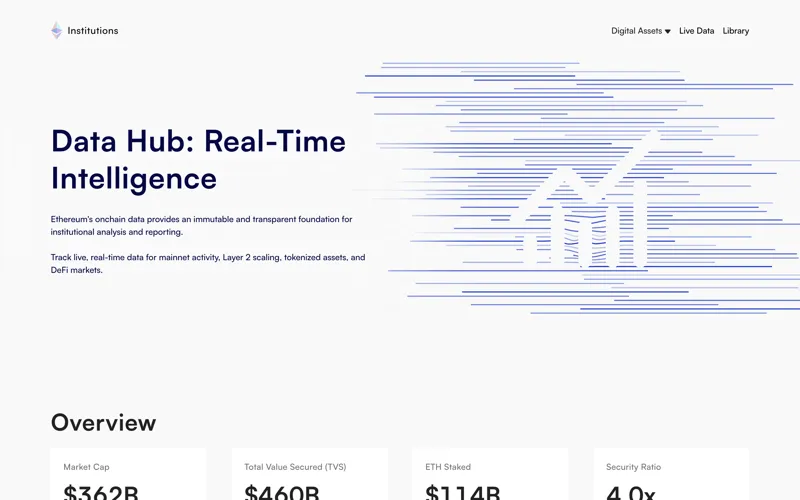
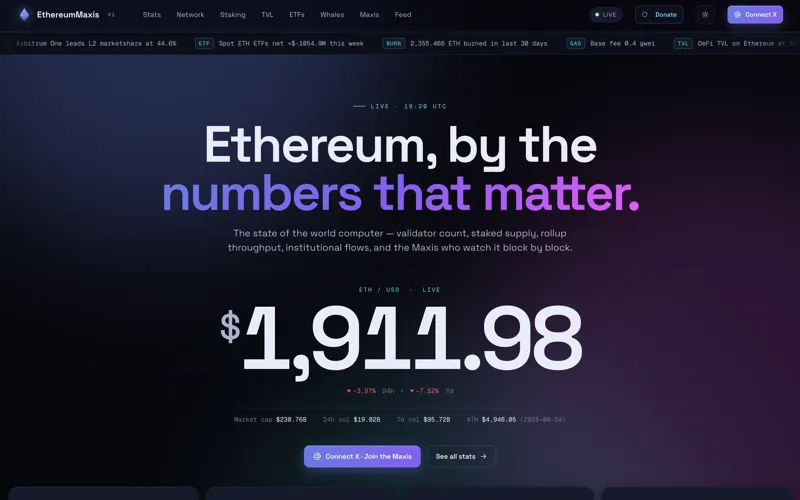
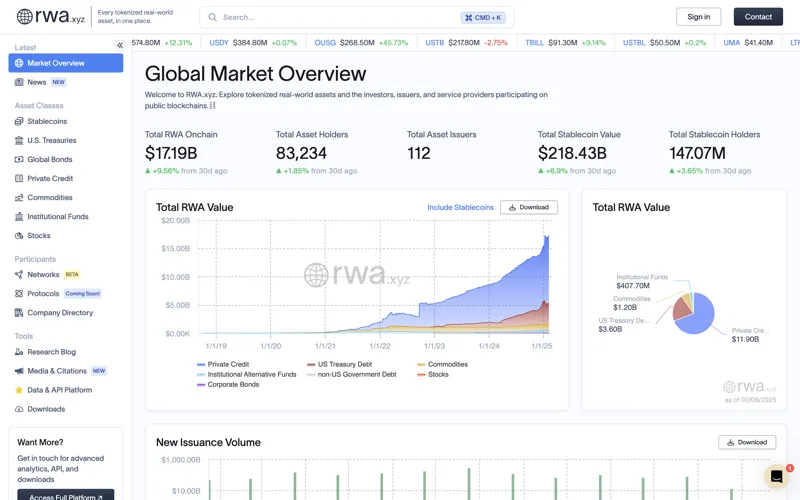
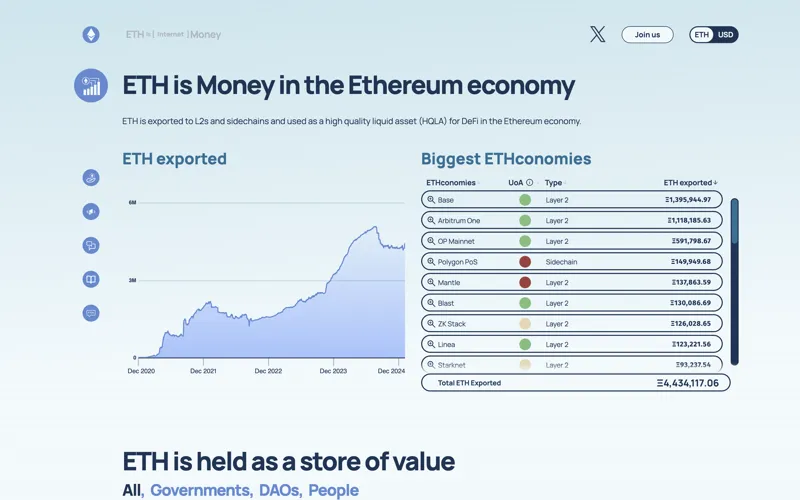
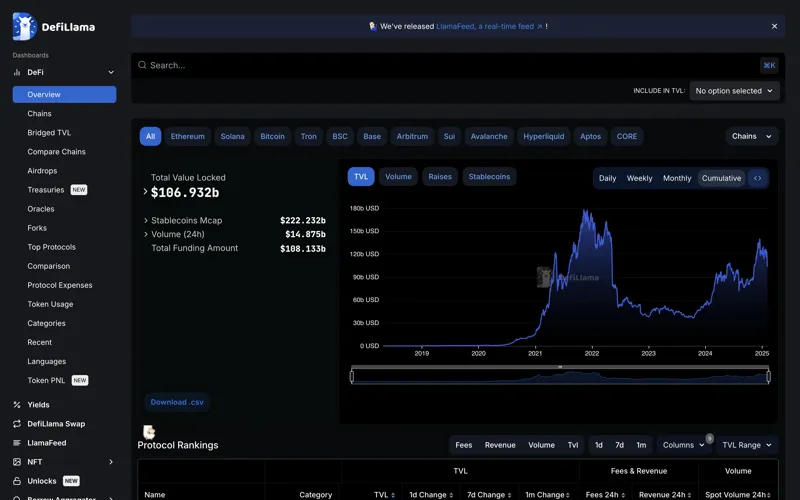
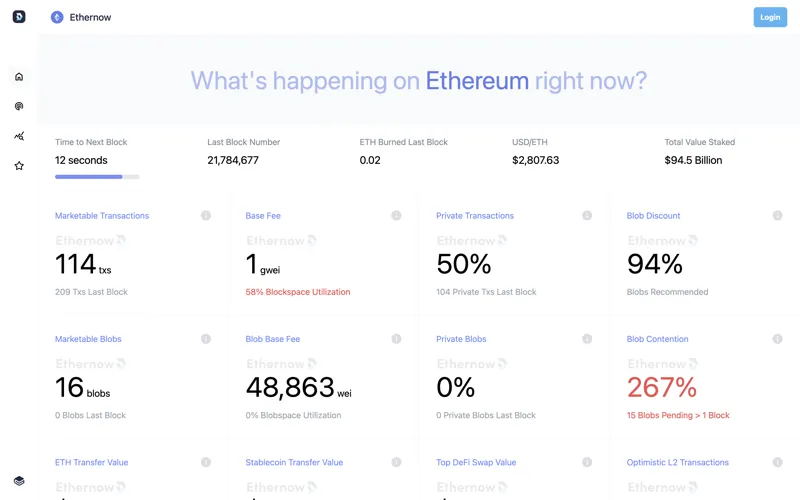
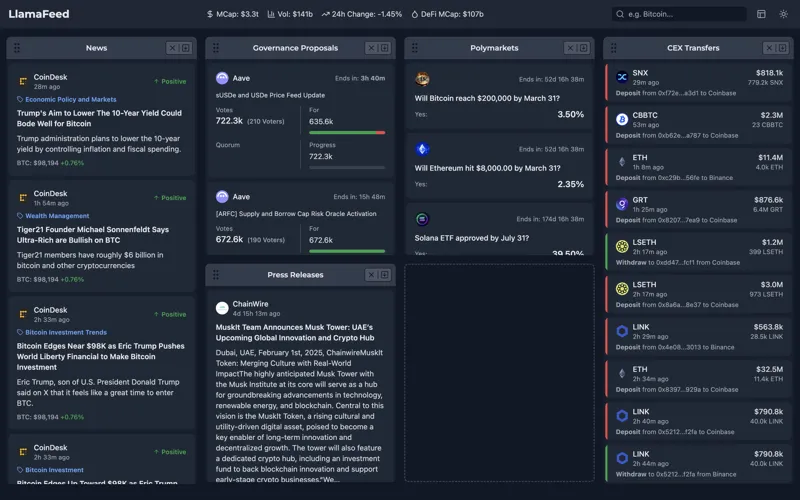
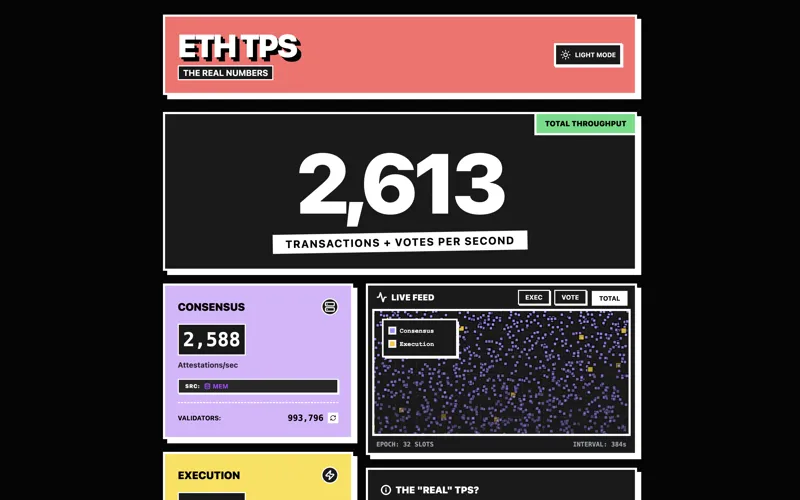
Track live, real-time data for mainnet activity, Layer 2 scaling, tokenized assets, and defi markets.
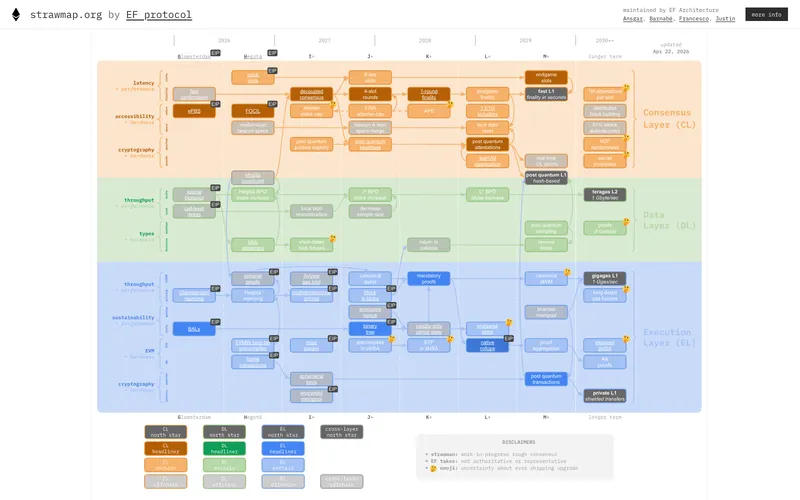
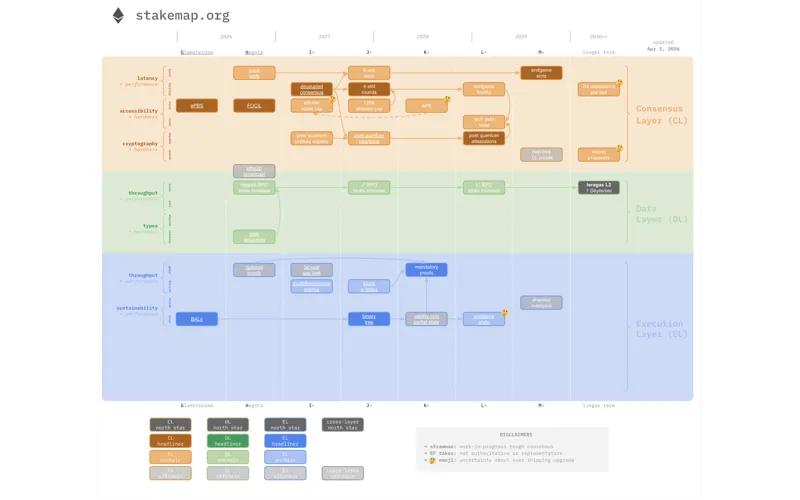
A work-in-progress draft Ethereum roadmap covering consensus, data, and execution layer priorities through 2030+.
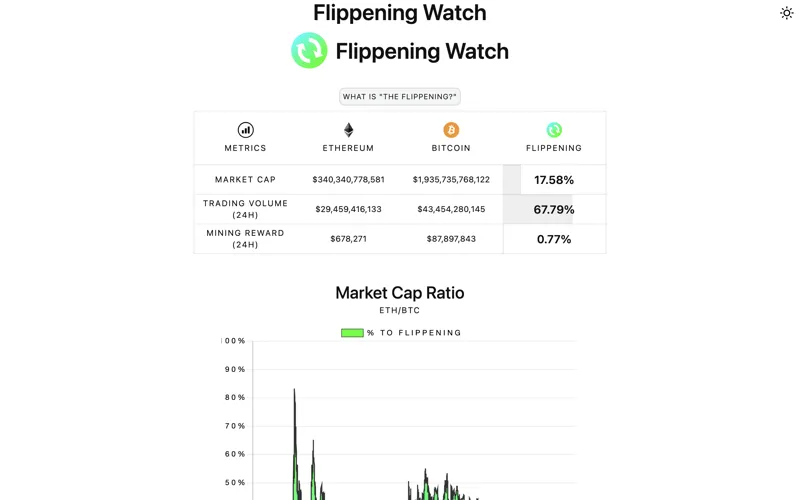
Monitor “The Flippening”, a possible future event when Ethereum overtakes Bitcoin as the most valuable crypto in market cap.
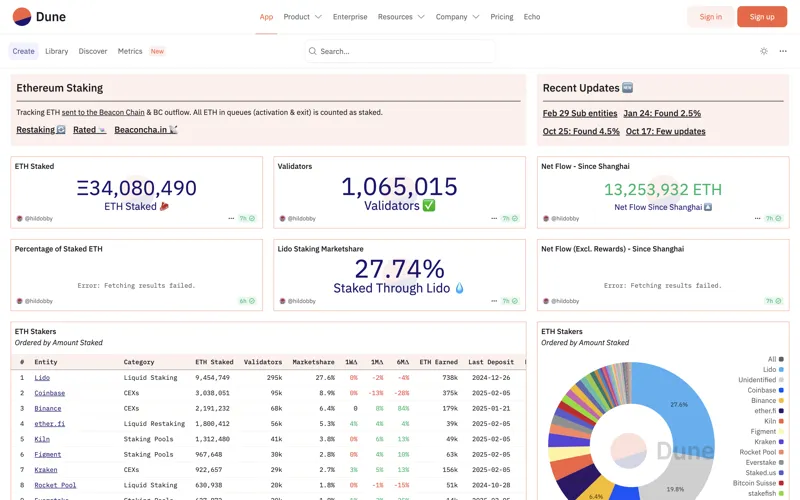
This dashboard tracks ETH sent to the Consensus Layer deposit address & beacon chain outflow.
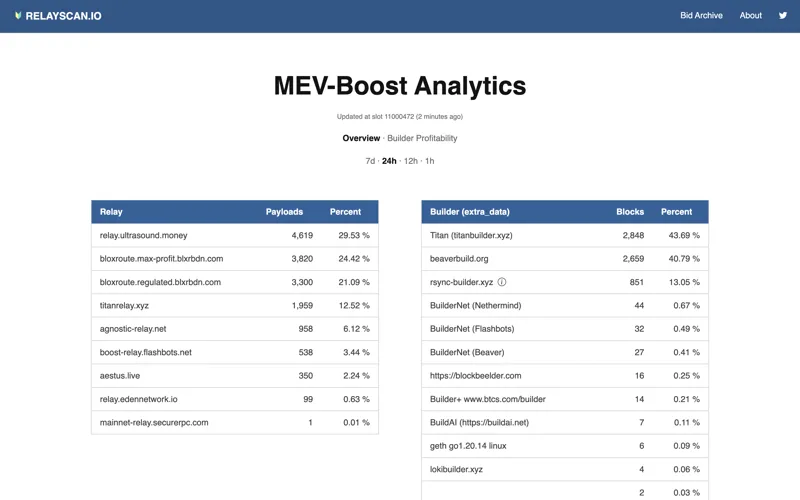
Monitoring, analytics & data for Ethereum MEV-Boost builders and relays.
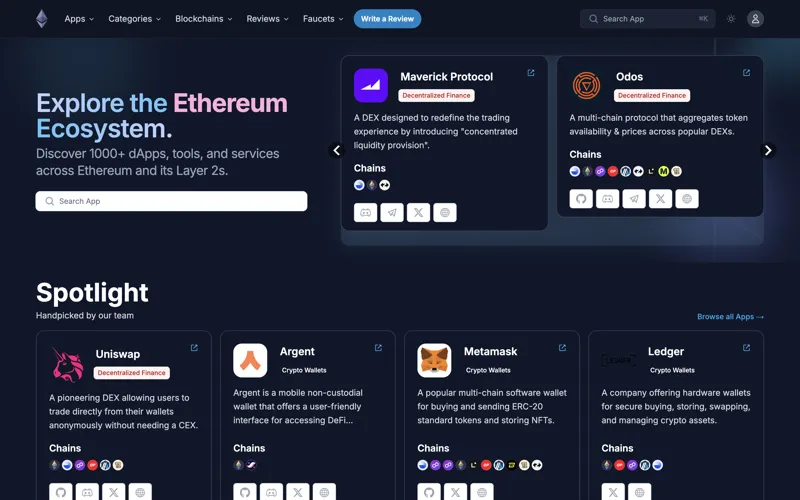
Explore the Ethereum ecosystem and discover 1000+ dApps, tools, and services across Ethereum and its Layer 2s.
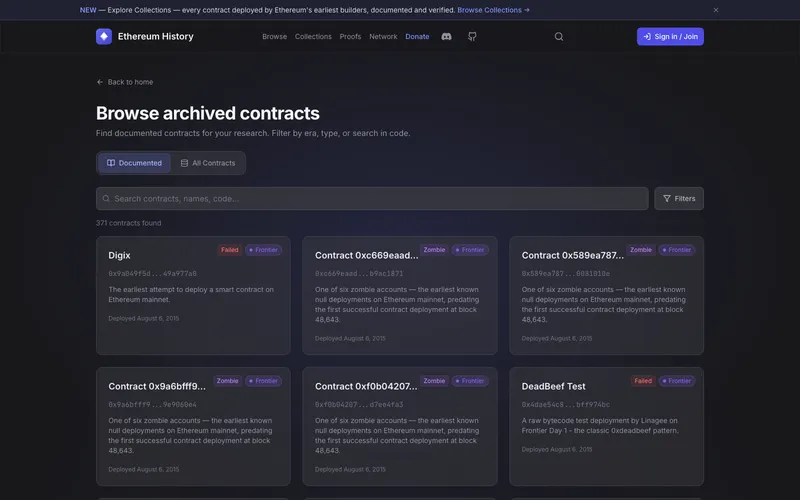
A historical archive and analysis tool for Ethereum smart contracts from the early years.
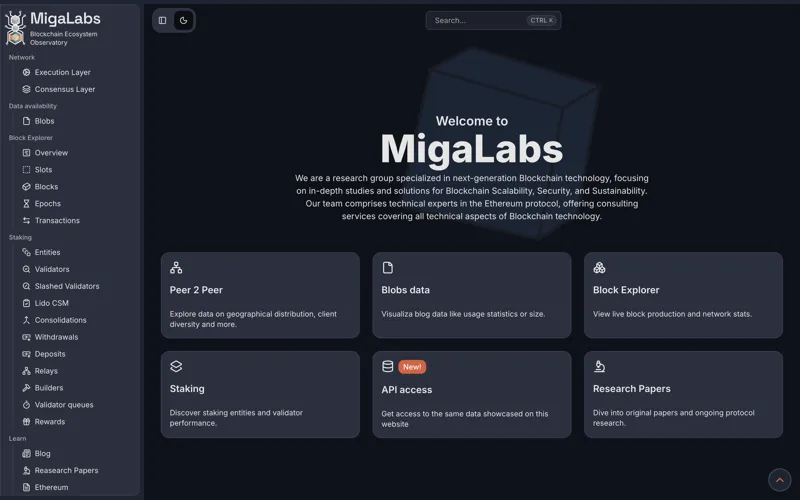
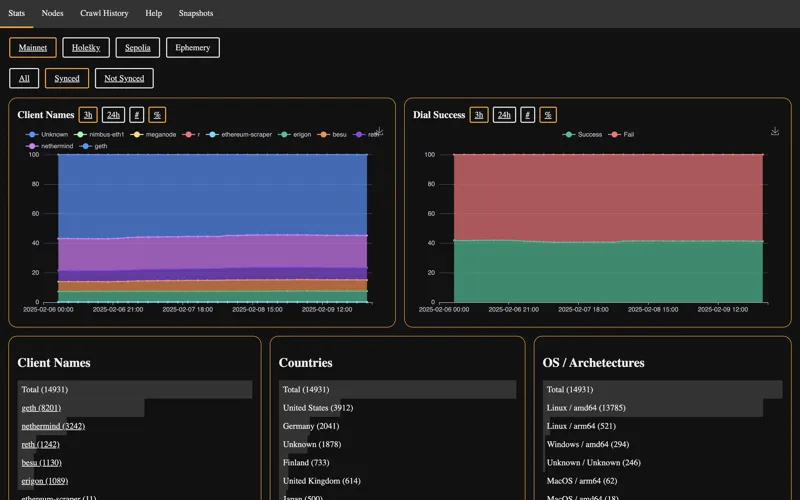
Discover Ethereum through MigaLabs blockchain ecosystem observatory.
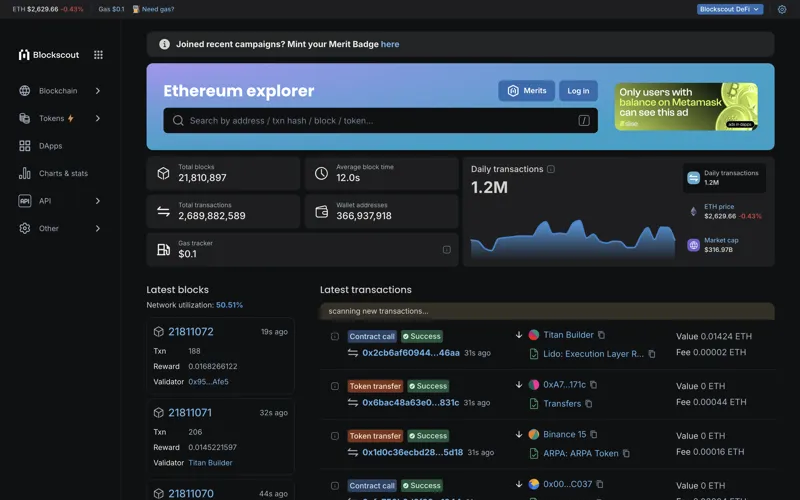
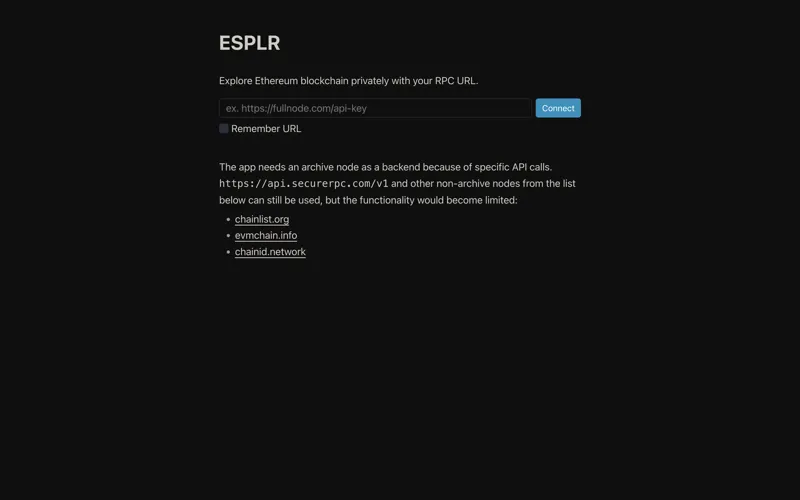
Open-source block explorer to view transactions, verify contracts, and analyze onchain data across Ethereum, L2s, and all EVM networks.
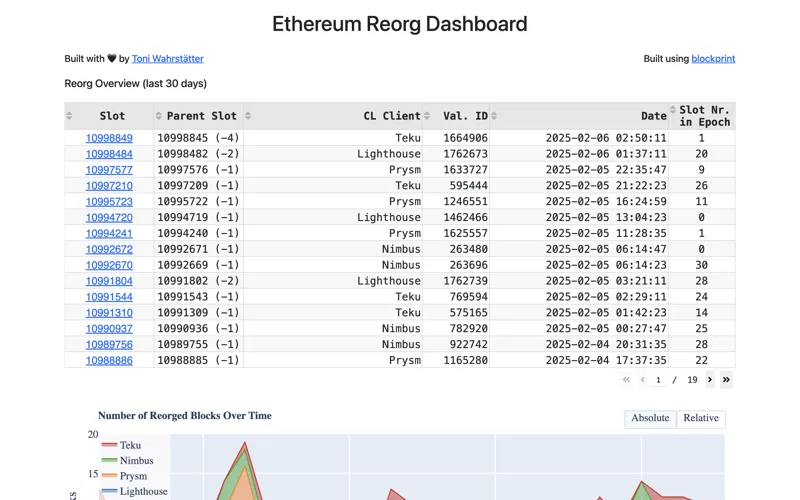
Selected comparative visualizations on reorged blocks on Ethereum.
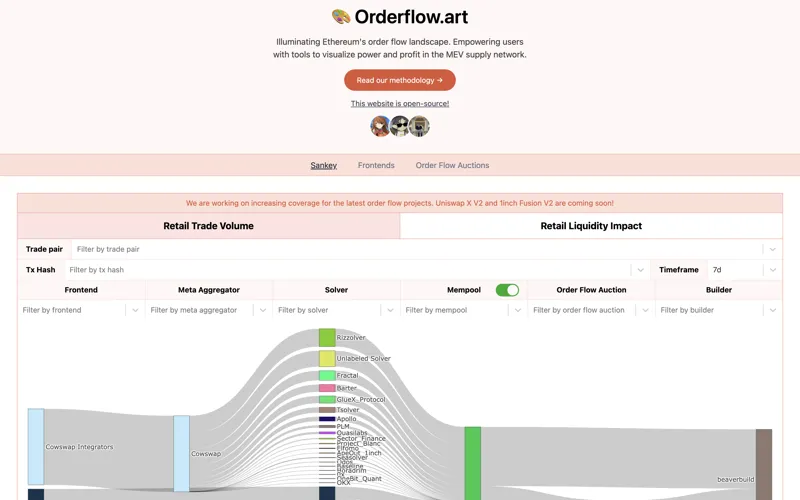
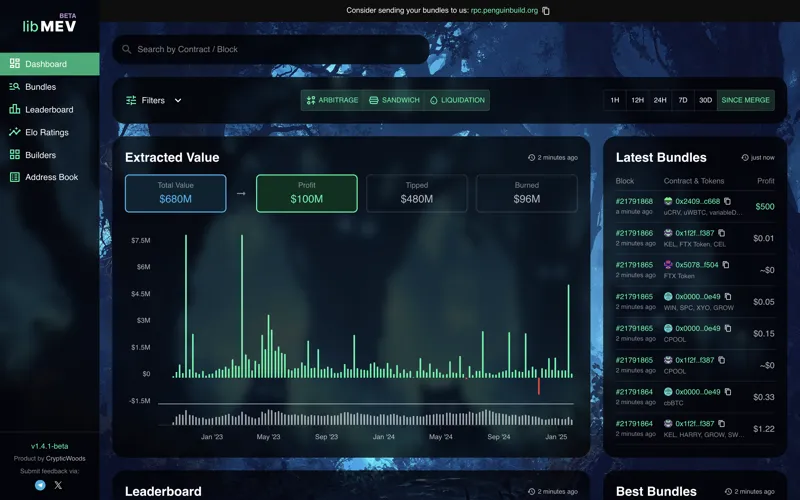
Illuminating Ethereum's order flow landscape with tools to visualize power and profit in the MEV supply network.
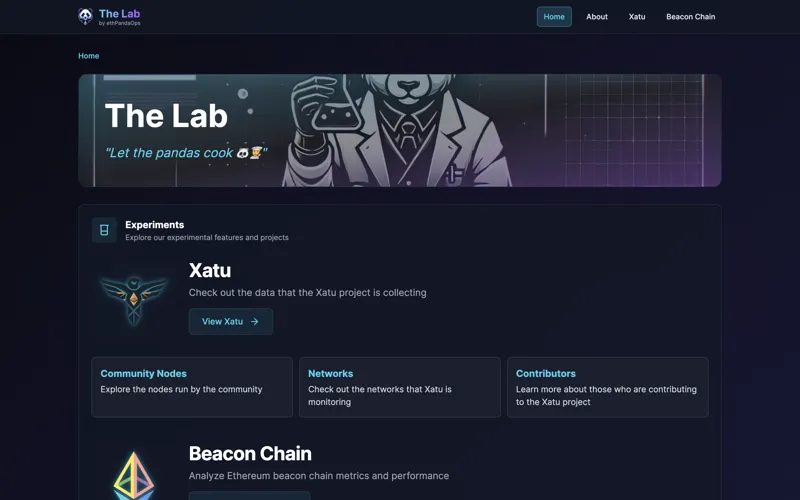
Experimental platform for exploring Ethereum data and network statistics.
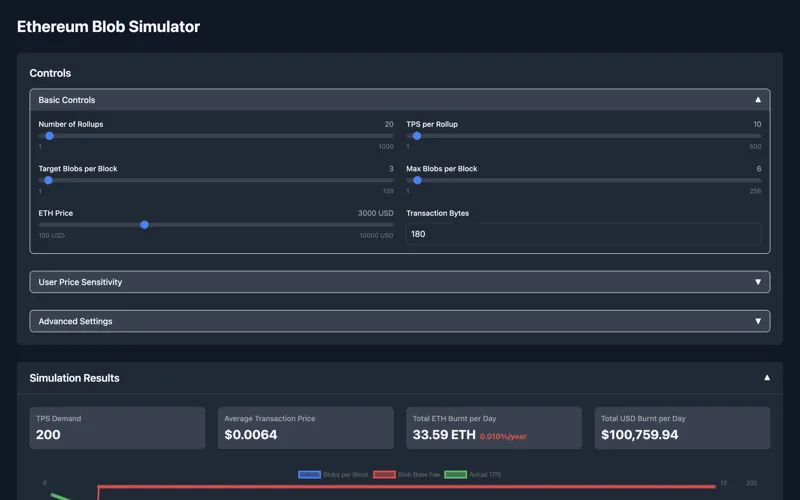
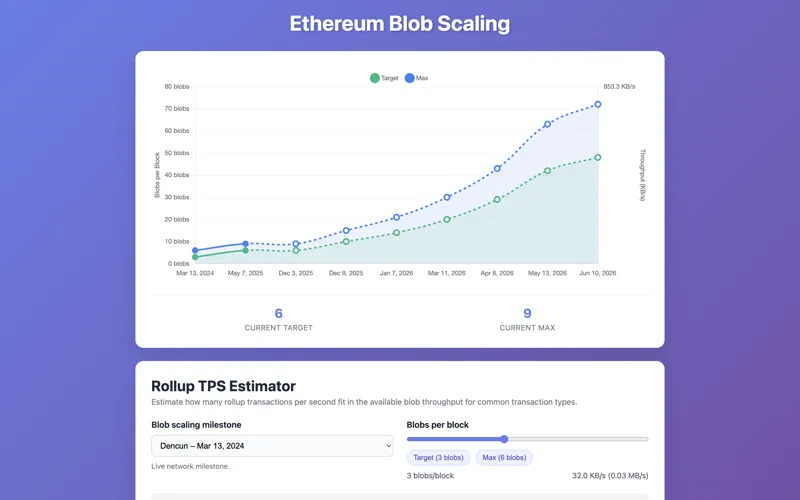
Simulate changes in blob count, rollup count, and TPS to estimate blob usage.
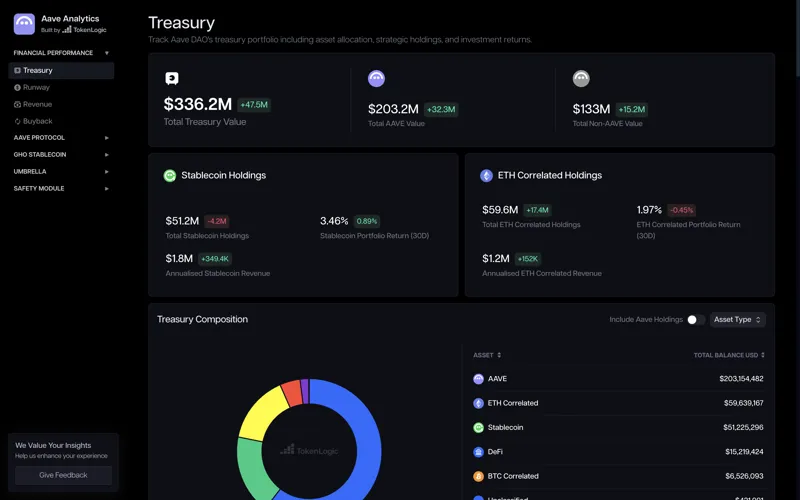
Real-time onchain analytics and insights across the Aave ecosystem.
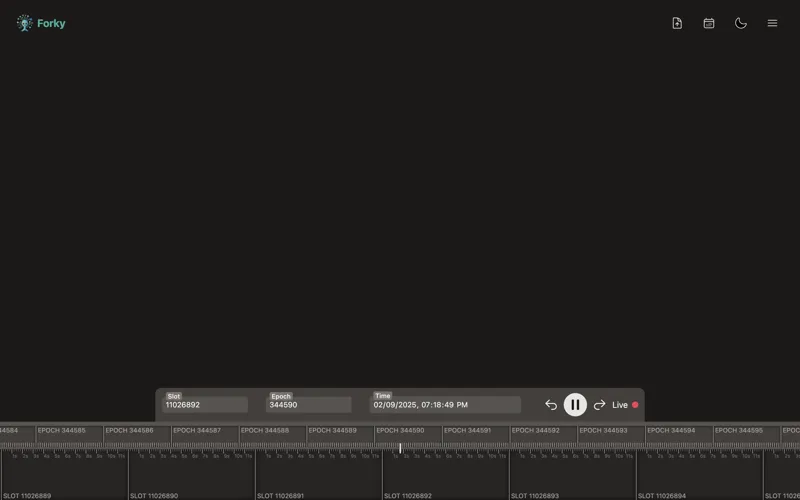
Forky captures, stores and visualizes live fork choice data from the Ethereum network.
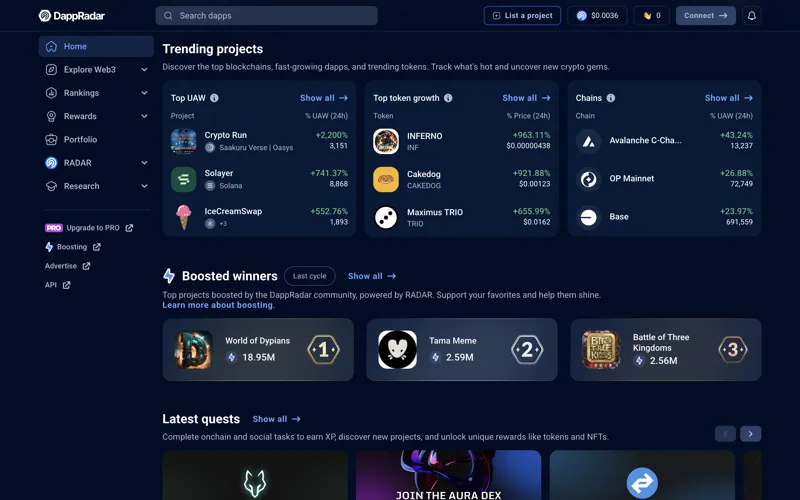
Track your portfolio and discover fast-growing dapps and trending tokens.
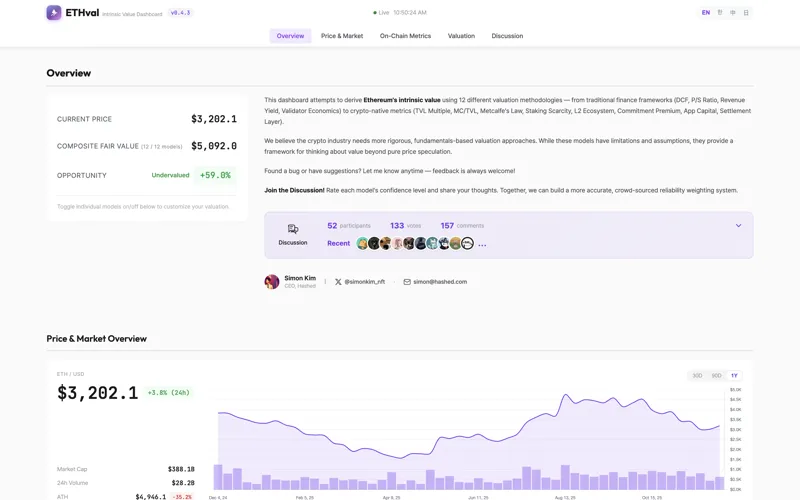
A dashboard attempting to derive Ethereum's intrinsic value using different valuation methodologies.
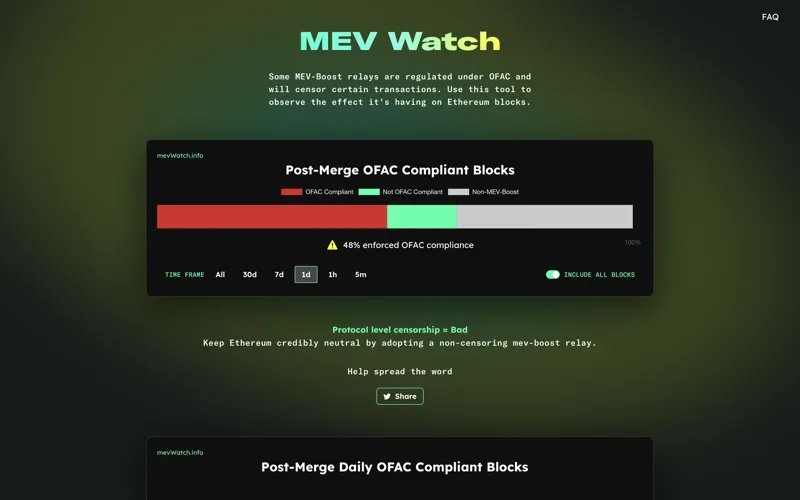
Some MEV-Boost relays are regulated under OFAC and will censor certain transactions. Use this tool to observe the effect it's having on Ethereum blocks.
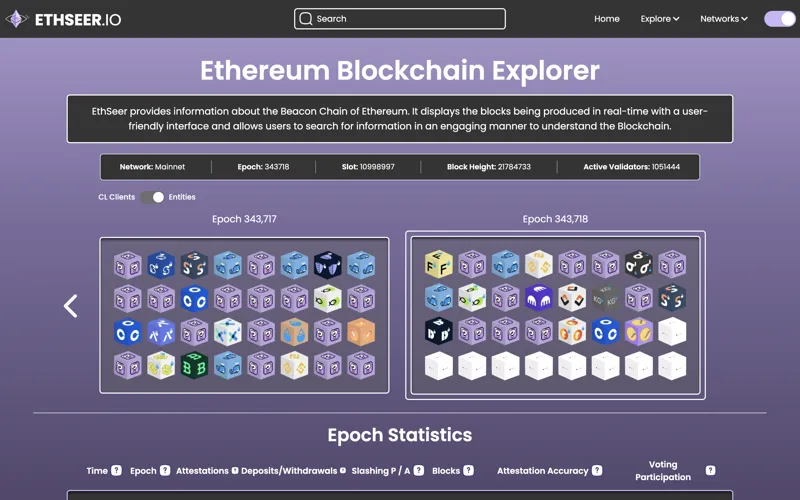
EthSeer provides information about Beacon Chain blocks being produced in real-time.
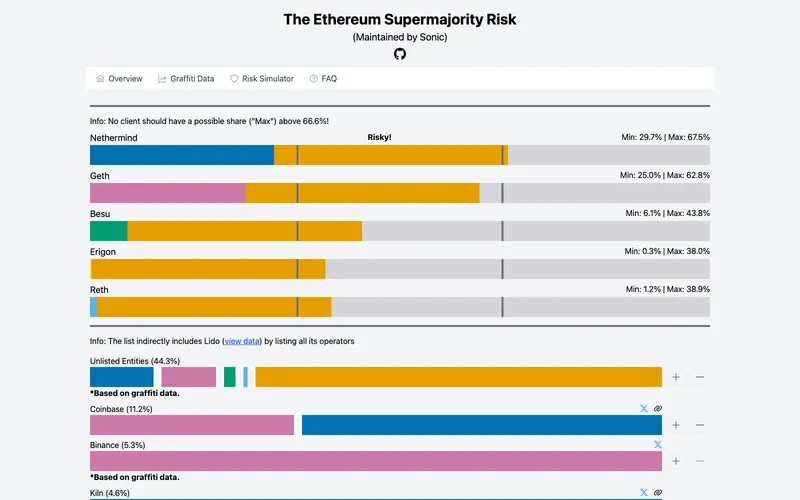
The supermajority client risk of the Ethereum execution layer, especially the client usage of staking services and pools.
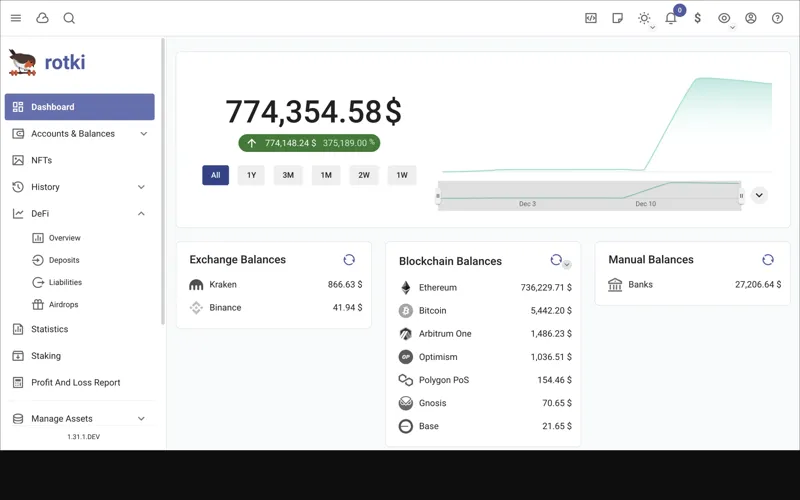
Rotki is an open source portfolio tracker, accounting and analytics tool that protects your privacy.
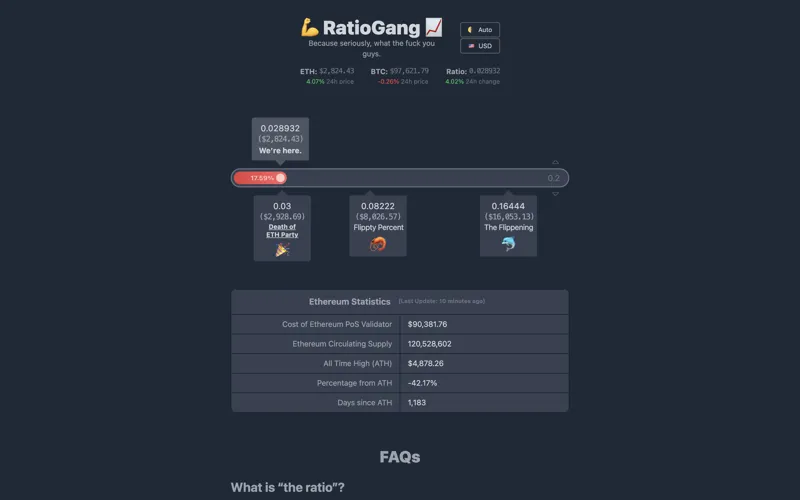
Ratio Gang assemble! Monitor the progress of Ethereum (ETH) in overtaking Bitcoin (BTC) by market cap.
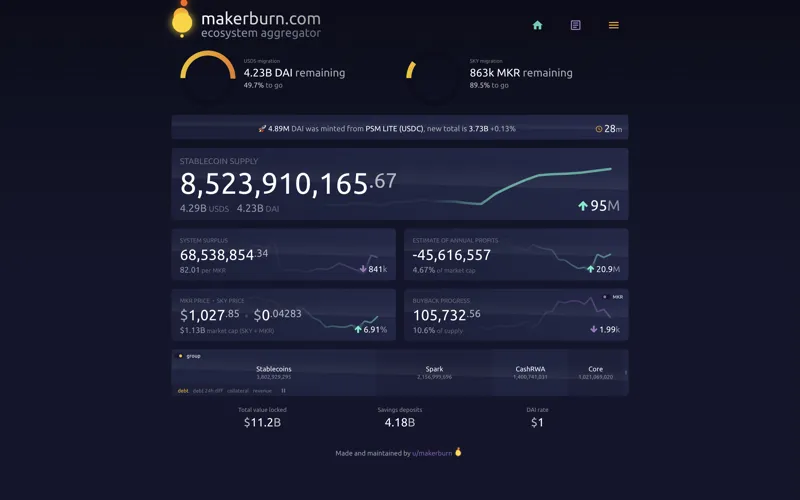
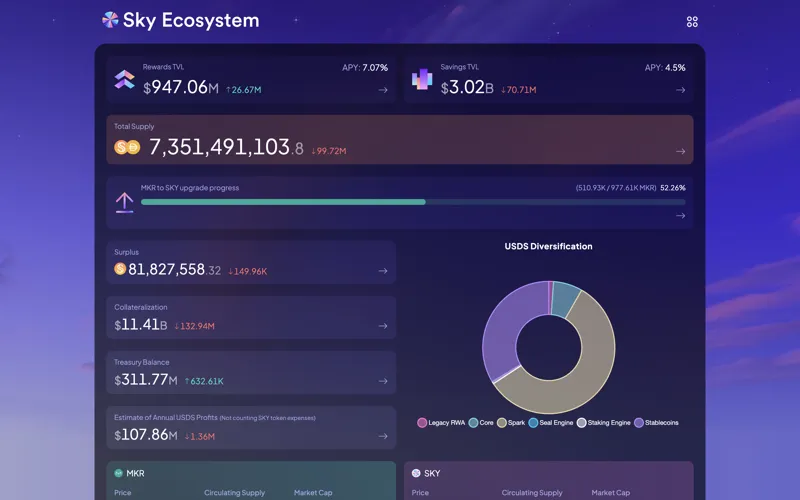
Dashboard for watching DAI/USDS minting and MKR/SKY token burning in real time.
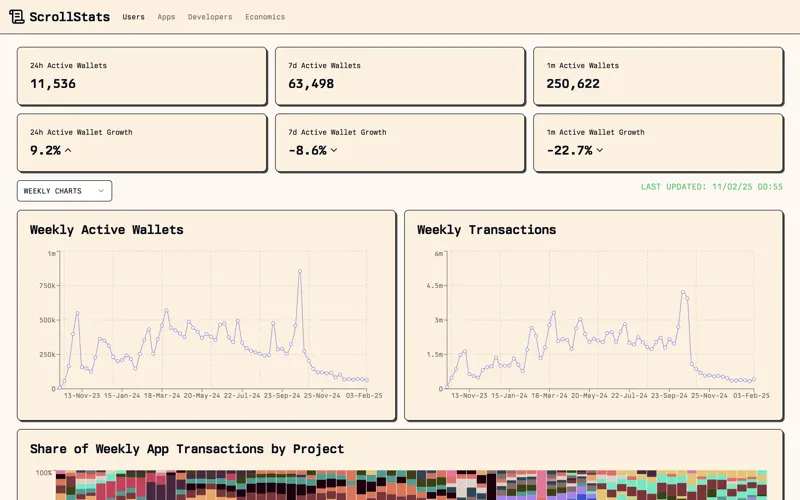
A dashboard tracking the activity and adoption metrics of Scroll users.
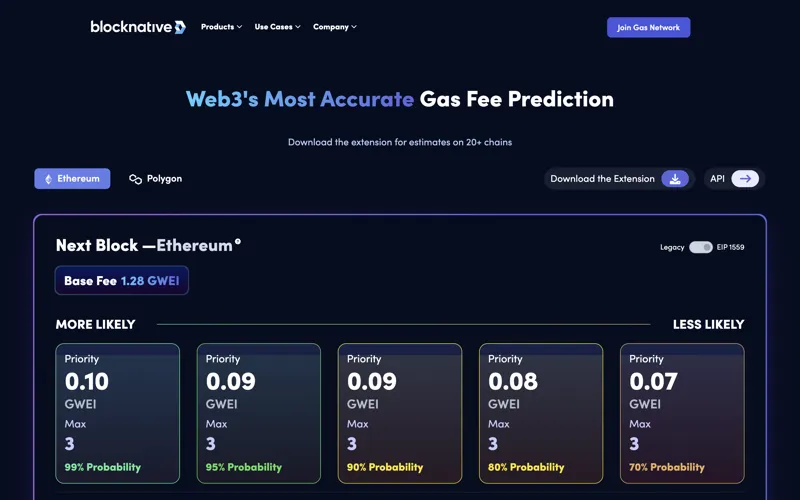
Accurate gas prediction to help getting into the next block without overpaying.
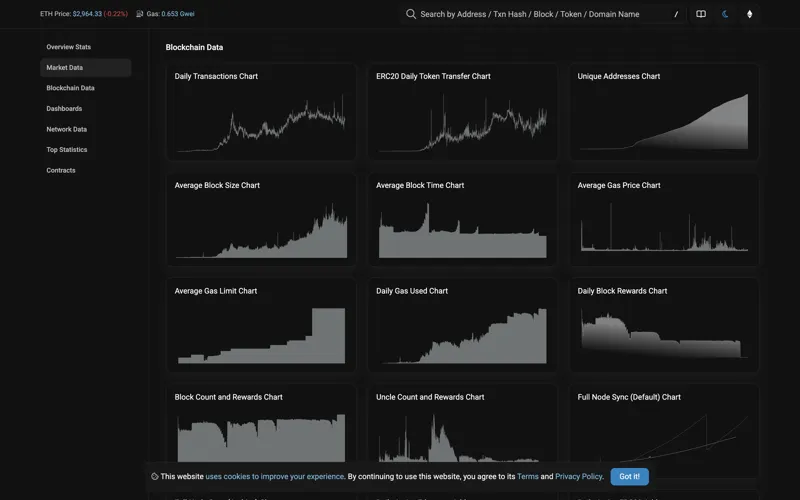
A collection of Ethereum charts and statistics showing market data, on-chain data, network data, top statistics, and contract data.
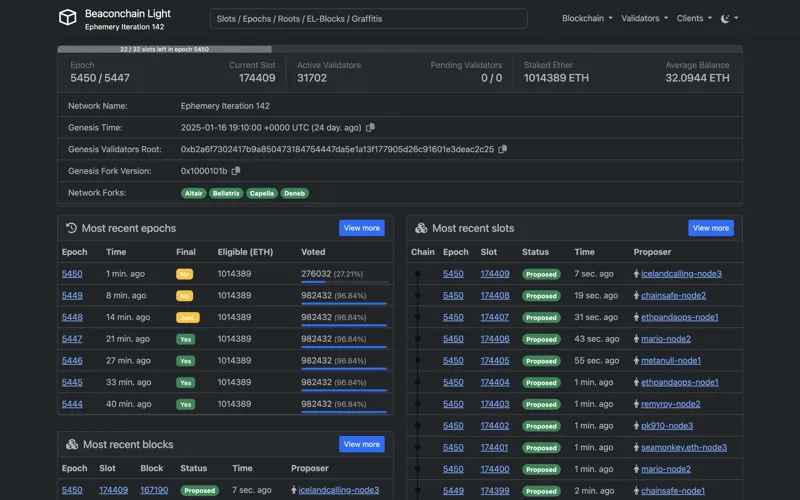
An open source lightweight explorer to view and interact with the data on the Ethereum Beacon Chain.
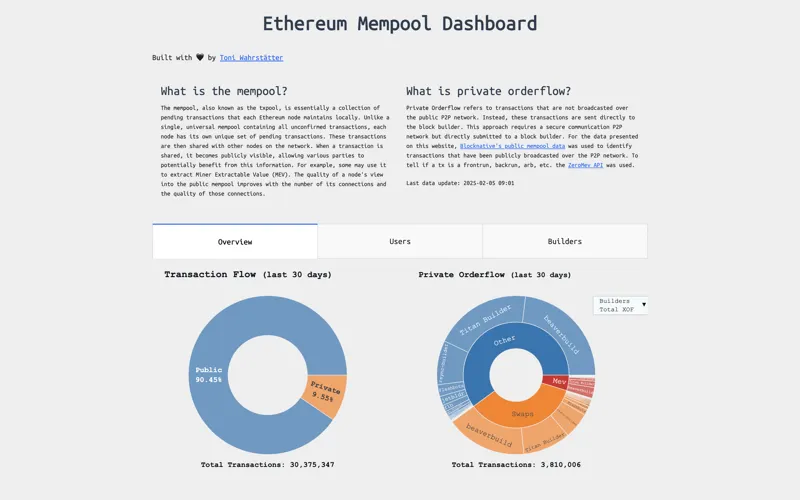
Realtime mempool monitoring to visualize, capture, and filter enriched pre-chain event data.
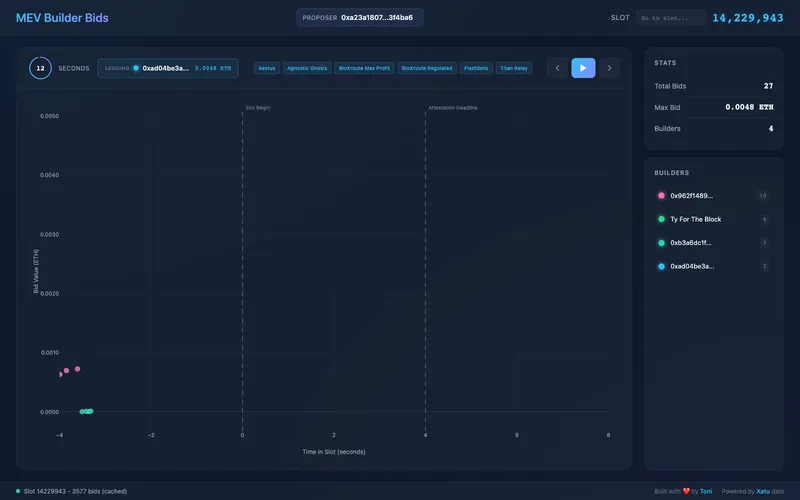
Real-time visualization of MEV builder bids as block builders compete for block space on Ethereum.
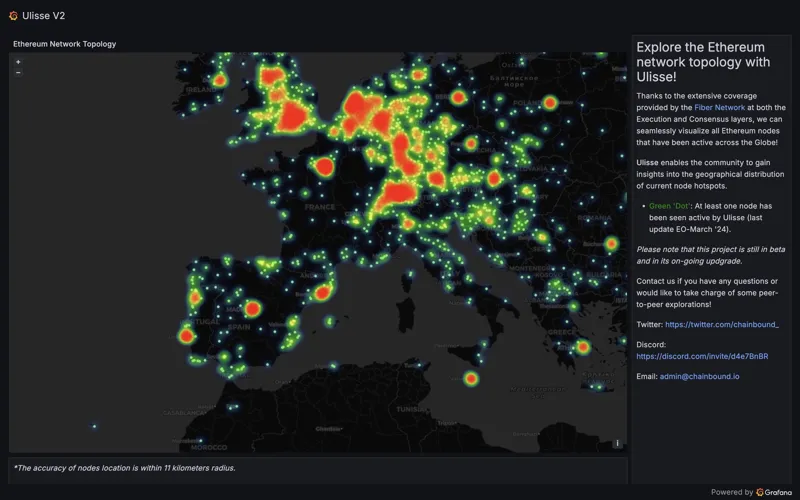
Visualize geographical distribution of active Ethereum nodes across the world.
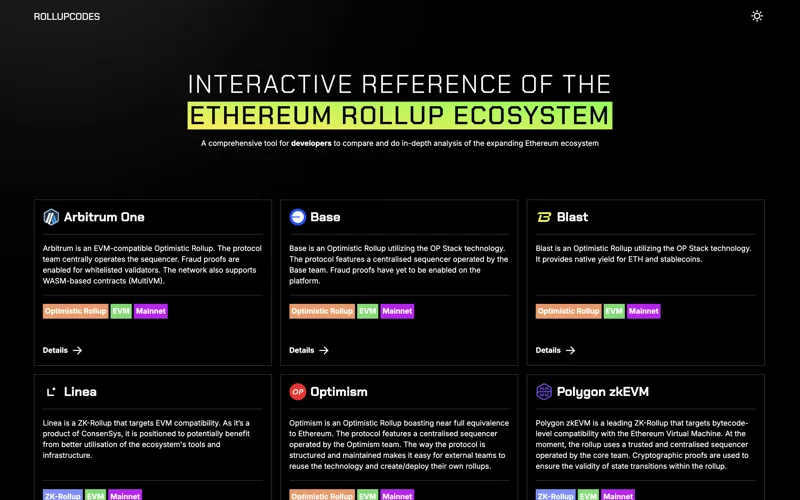
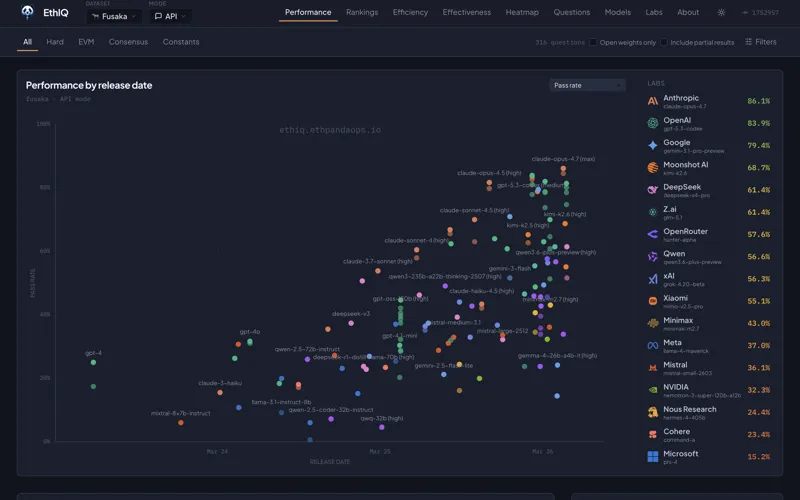
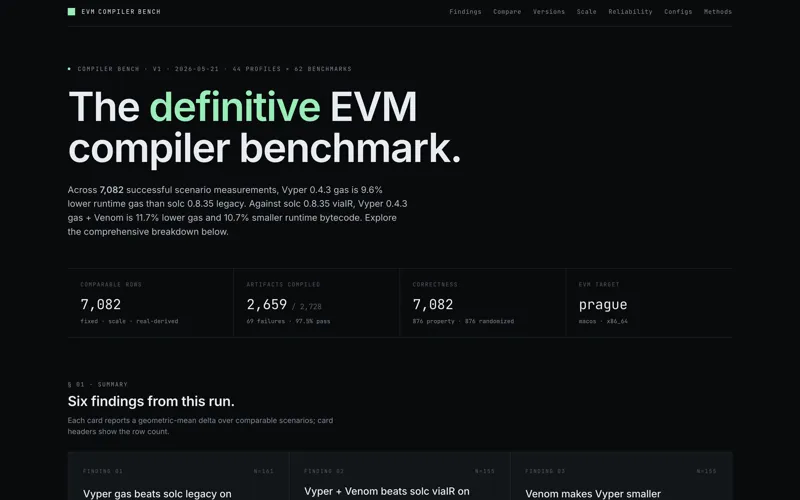
A comprehensive tool for developers to compare and do in-depth analysis of the expanding Ethereum ecosystem.
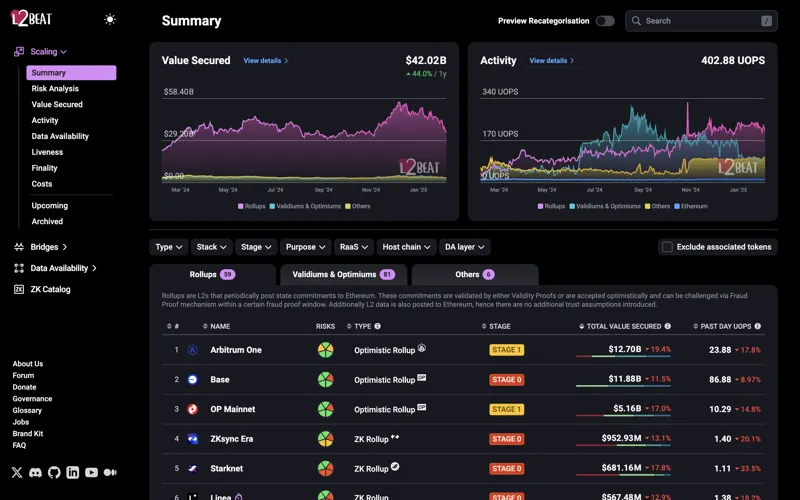
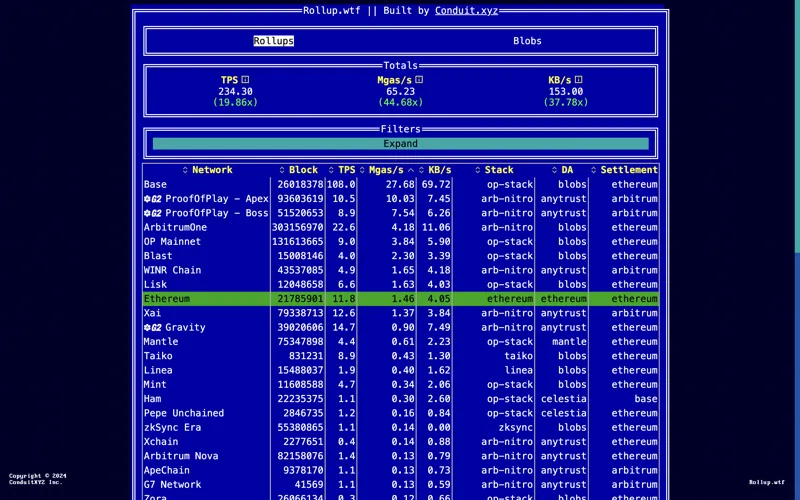
Analytics and research website about Ethereum layer 2 scaling, comparing major protocols live on Ethereum today.
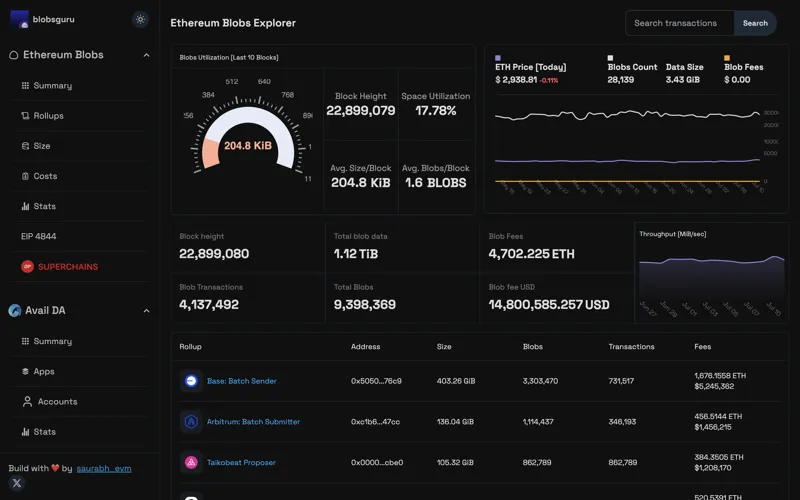
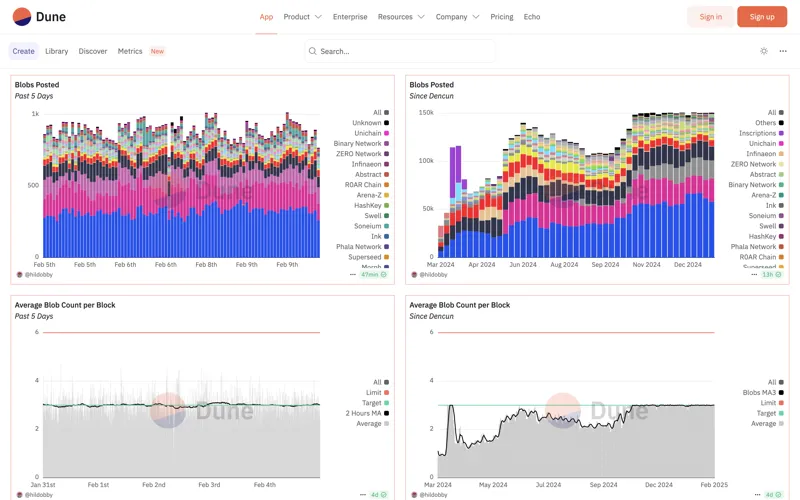
Analyze Layer 2 blob transactions and EIP-4844 data for improved scalability and efficiency.
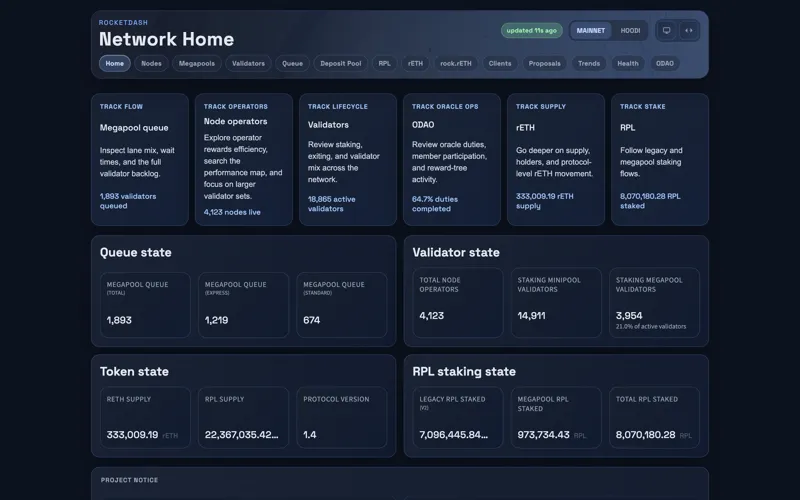
Real-time Rocket Pool dashboard for protocol metrics, validator activity, megapool queue status, and network statistics.
This dashboard tracks mev-boost blocks with a known pattern in them, representing blocks created by block-builders.
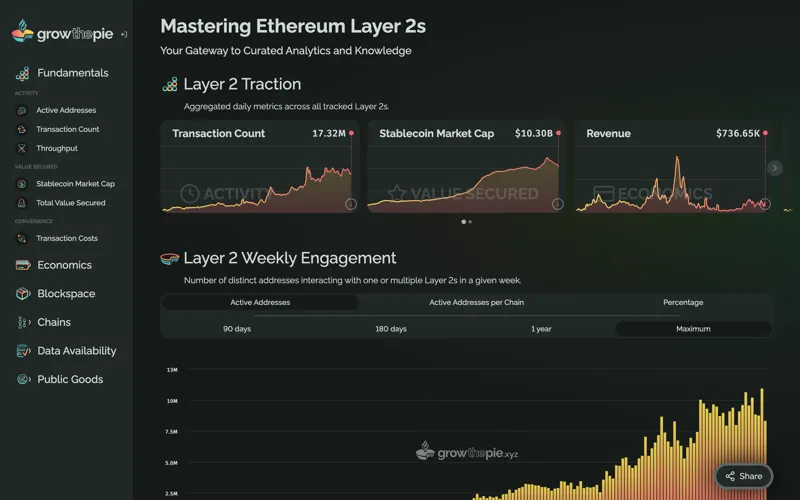
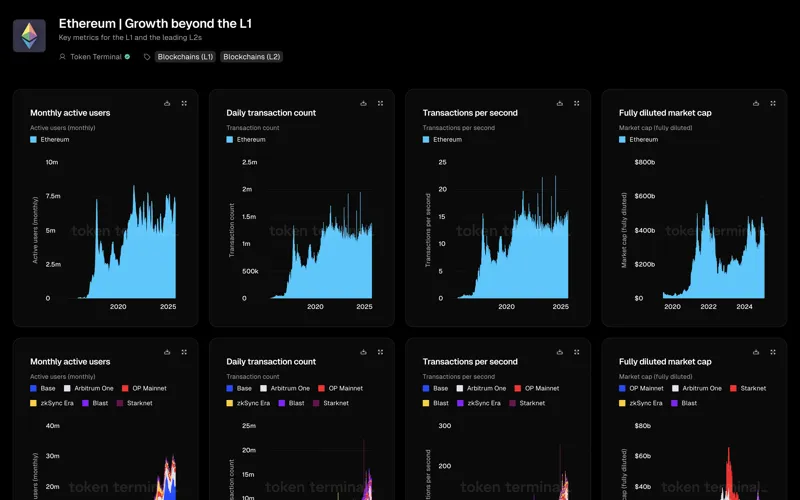
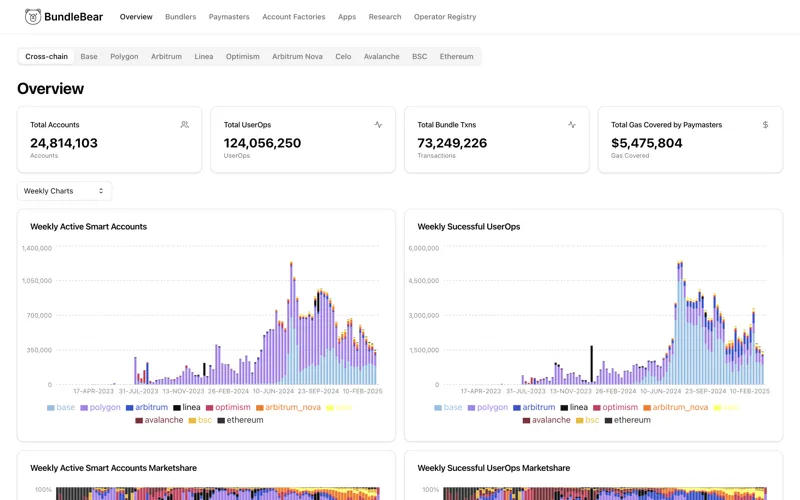
Ethereum and Layer 2 analytics covering fundamental metrics, economics, blockspace usage, and much more.
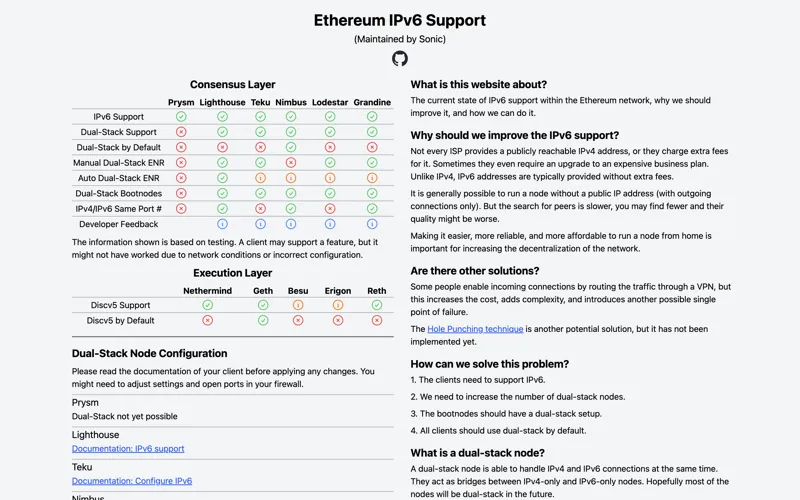
The current state of IPv6 support within the Ethereum network, why we should improve it, and how we can do it.
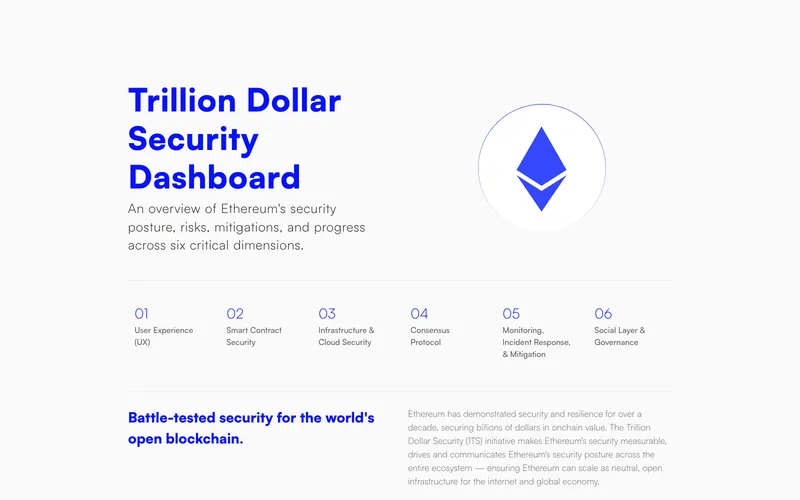
An overview of Ethereum's security posture, risks, mitigations, and progress across six critical dimensions.
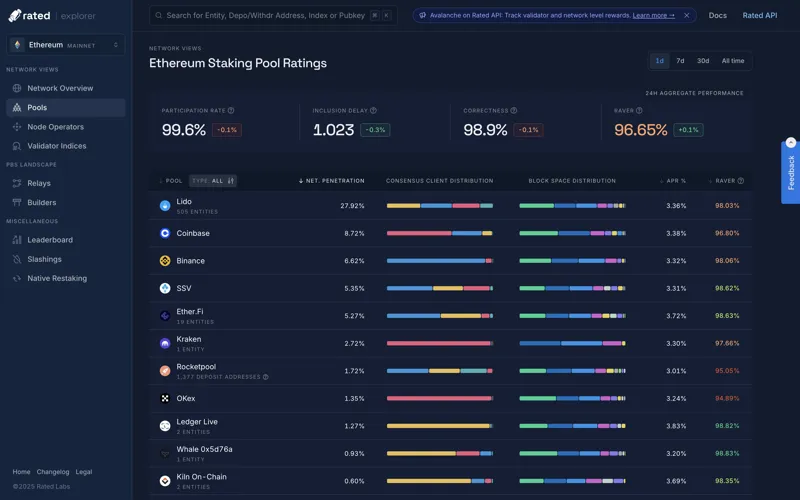
A measure of uptime — how available a validator or entity has been to provide network services.
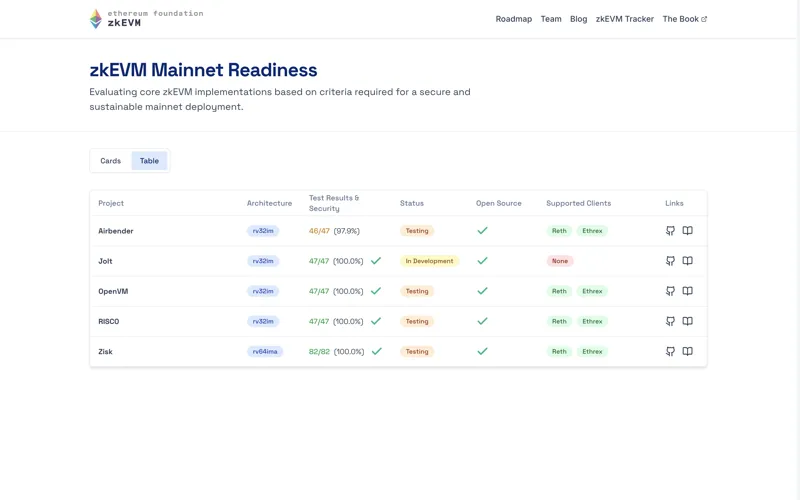
Evaluating core zkEVM implementations based on criteria required for a secure and sustainable mainnet deployment.
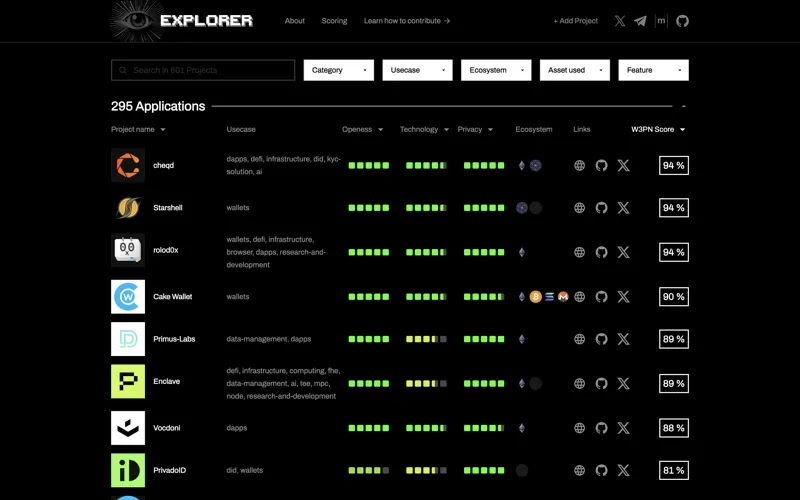
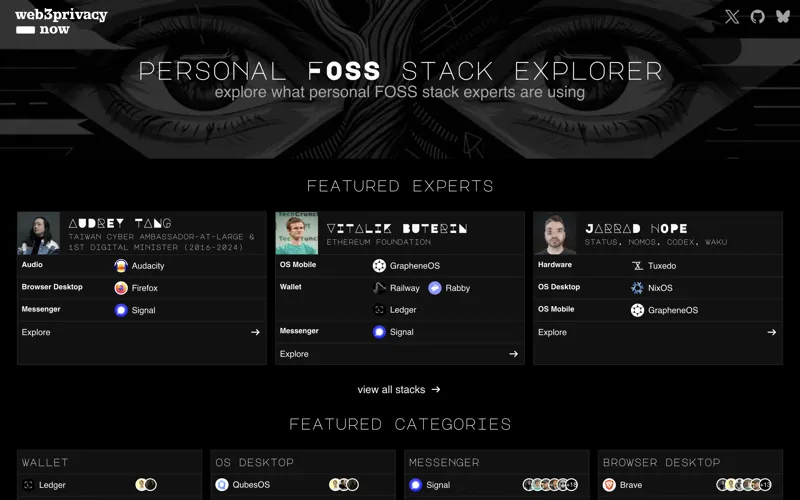
A 3 in 1 ranking system, database & comprehensive profiling to empower the general public in discerning the privacy levels, security, and reliability of Web3 projects.
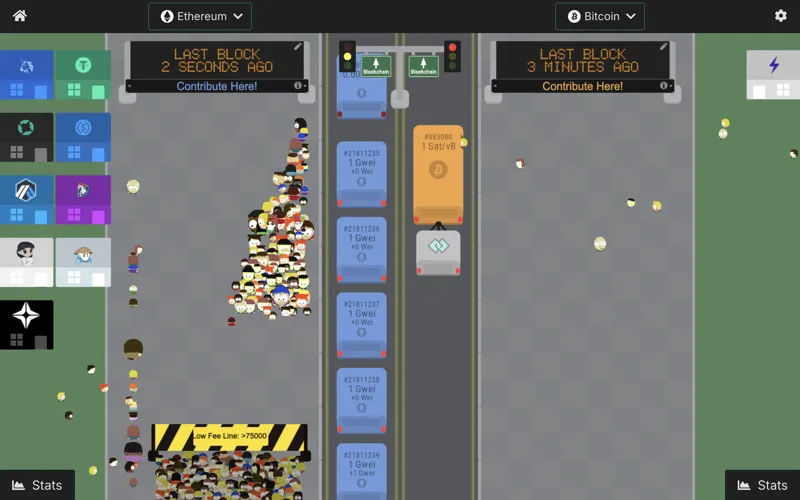
Live Ethereum transaction visualizer with every tx as a person filling up buses which represent blocks.
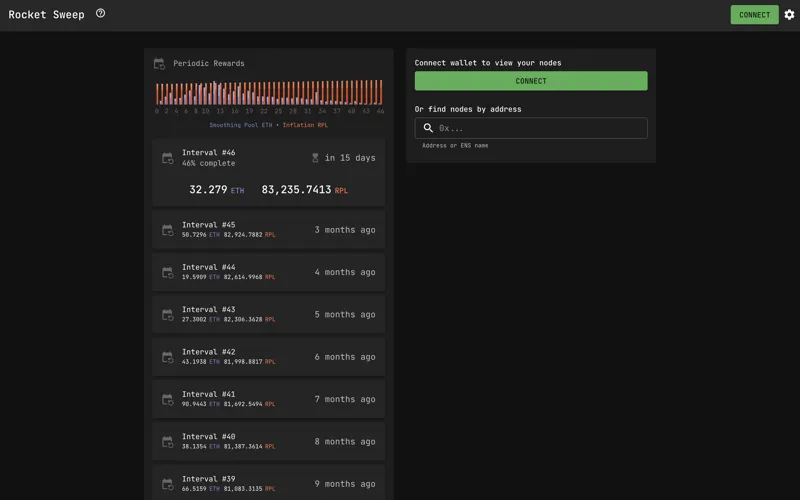
A tool for Rocket Pool node operators to view and claim rewards.
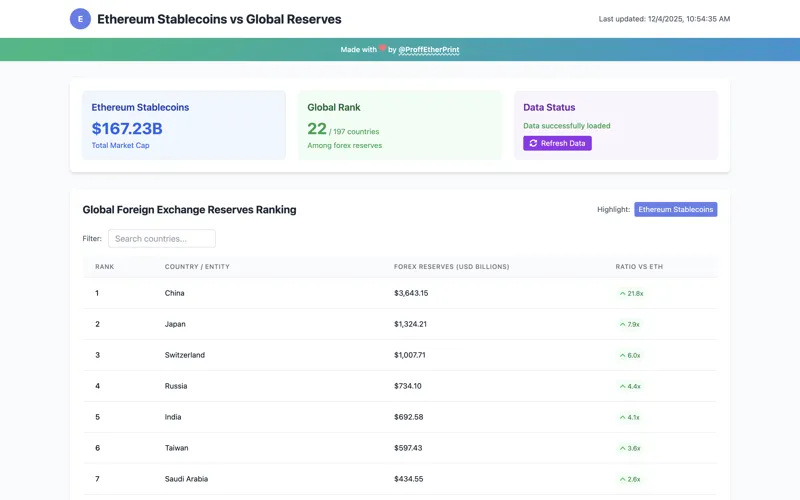
Compare Ethereum stablecoin market cap against all countries' foreign exchange reserves.
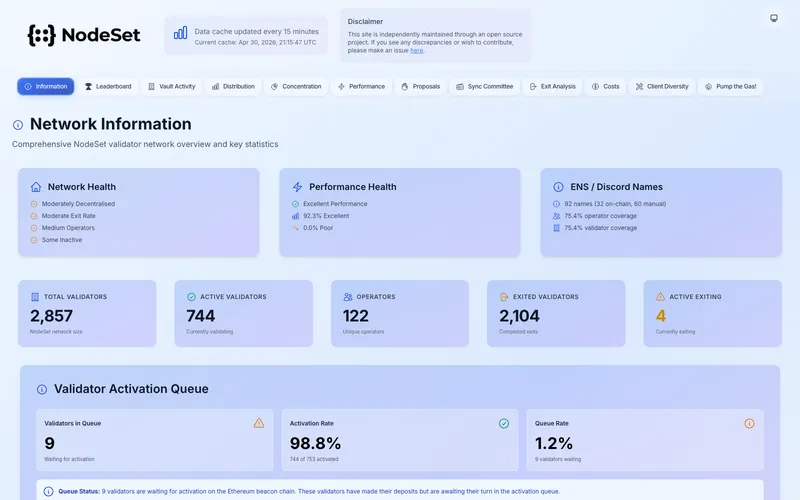
NodeSet validator monitoring dashboard to track Ethereum validators on Stakewise protocol.